Join Our Telegram channel to stay up to date on breaking news coverage
LTC Price Prediction – February 5
Litecoin (LTC) gains 6.79% in the last 24 hours to touch $156. It may find the next resistance at $160.
LTC/USD Market
Key Levels:
Resistance levels: $180, $190, $200
Support levels: $125, $115, $105
LTC/USD has been exhibiting strength over the last 24 hours but manages to regain some ground amid technical correction from the downward trend where it is traveling from $145 to $156. The coin has recovered from the sharp sell-off of yesterday. More so, the range of the price swings has been between $122 and $156. The overall gain of the day stands at 6.79%.
What to Expect from Litecoin (LTC)
Moreover, though the current price of Litecoin at $155.14 is above the 9-day moving averages and 21-day moving averages within the descending channel, the recovery seems to have started as the technical indicator RSI (14) faces the north. The Litecoin (LTC) needs to continue its up-trending growth in the coming days to recover properly. As per the current trend, the next resistance level is likely at $180, $190, and $200.
On the downside, a sustainable move below the moving averages could open up the way to a $130 support level and this barrier may likely slow down the bears and then serve as a jumping-off ground for the recovery. Meanwhile, the next support levels to watch for could be $125, $115, and $105.
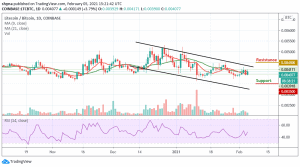
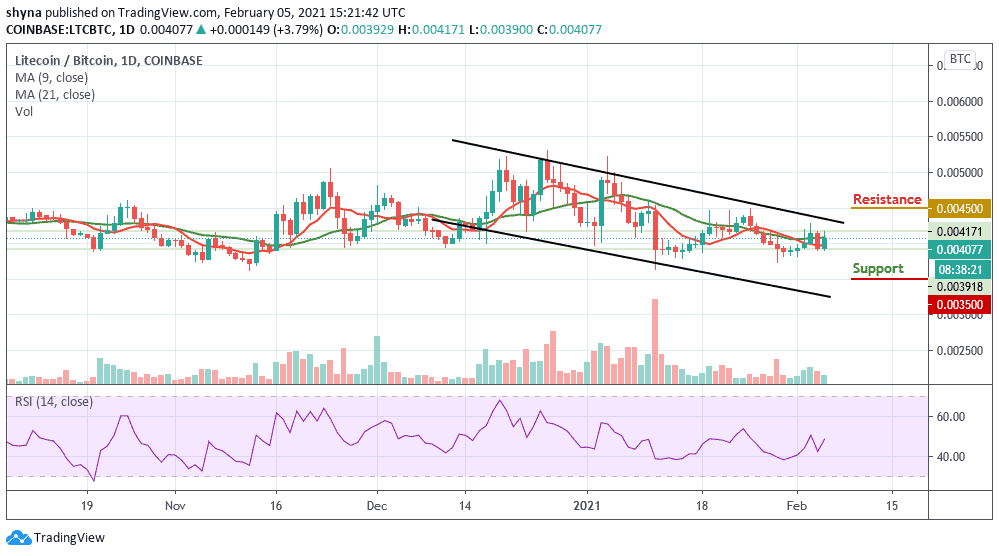
Against Bitcoin, LTC continues to trend bearishly as the support further outweighs the resistance. In case of a trend reversal, there is a need for an increasing volume and resistance to cause an upsurge in the market. Now, LTC/USD is trading around the 3700 SAT below the moving averages. We can expect close support at the 3500 SAT and below.
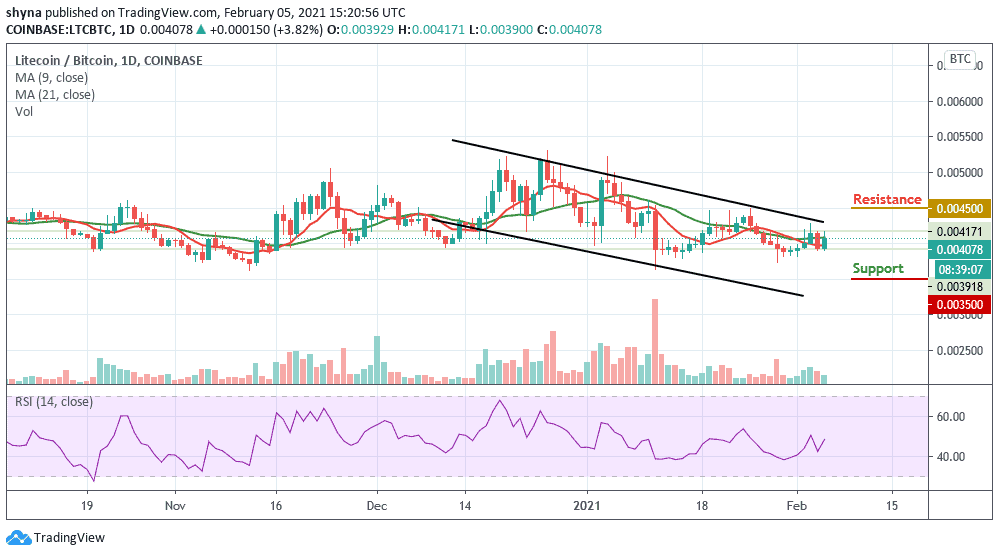
For now, there’s no sign of a bullish trend in the market. However, if a bullish move occurs and validates a break significantly above the upper boundary of the channel to hit the nearest resistance at 4400 SAT; we can then confirm a bull-run for the coin. More so, the closest resistance lies at 4500 SAT and 4700 SAT as the RSI (14) moving above the 45-level.
Join Our Telegram channel to stay up to date on breaking news coverage