Join Our Telegram channel to stay up to date on breaking news coverage
XRP Price Prediction – January 31
Ripple (XRP) is pushing higher as the bulls look firmly in control.
XRP/USD Market
Key Levels:
Resistance levels: $0.60, $0.65, $0.70
Support levels: $0.30, $0.25, $0.20
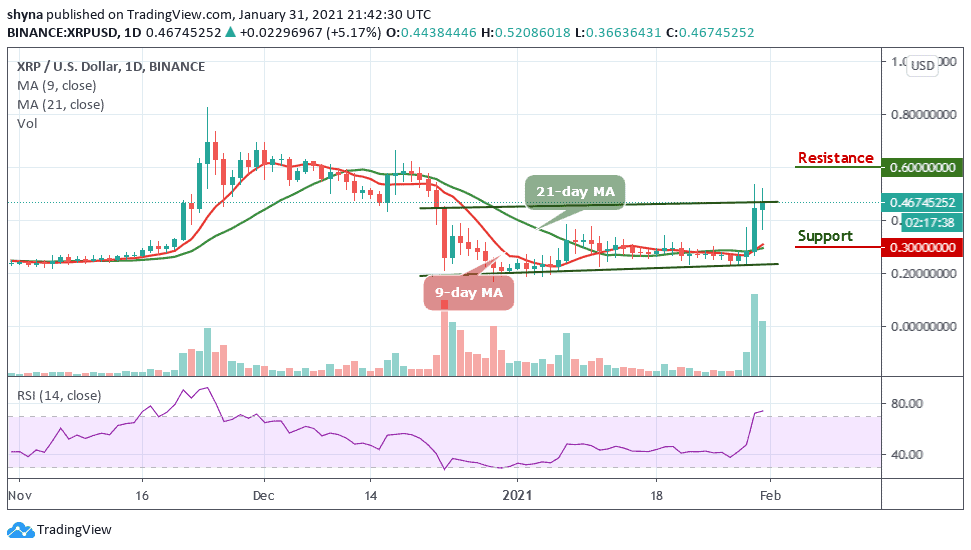
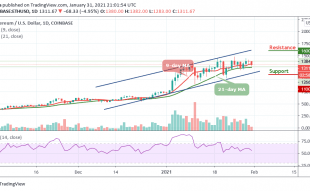
XRP/USD jumps from the daily low of $0.36 in a matter of hours and touches an intraday high at $0.52. However, the coin is currently trading at $0.46 with a gain of 5.17% above the moving averages. The market may begin a bullish trend as the 9-day moving average crosses above the 21-day moving average.
What to Expect from Ripple (XRP)
If the XRP bulls need to experience a shift in momentum, they will need to push the market price above the upper boundary of the channel, converting the moving averages into a support level. However, if the coin continues to trade upward, it may create a bull cross and a bullish breakout above $0.55 could take the Ripple (XRP) to the potential resistance at $0.60, $0.65, and $0.70 as the technical indicator RSI (14) moves to cross above the 70-level which is the overbought region.
Nevertheless, XRP/USD is trading at $0.46 after holding above $0.50. However, a drop beneath the moving averages may cause the Ripple price to spiral downward and head towards the $0.35 level. Meanwhile, if this level is broken, the sell-off may be extended to critical supports at $0.30, $0.25, and $0.20 respectively.
When compares with Bitcoin, XRP is range-bound, trading above the 9-day and 21-day moving averages at 1475 SAT. However, the bulls are trying to push the price upward, should in case they put more effort, they may likely hit the resistance levels of 1800 SAT and 2000 SAT respectively.
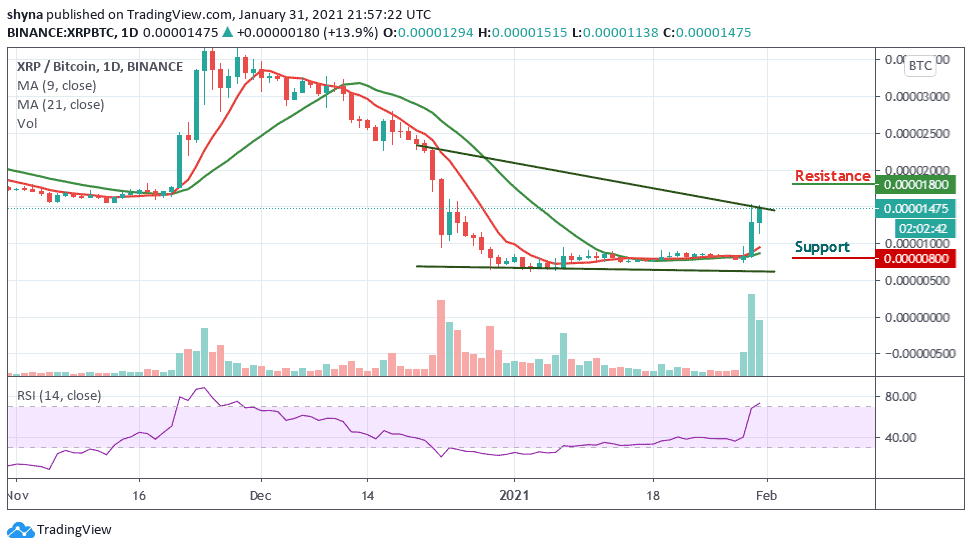
Moreover, if the buyers failed to hold the price, the coin may likely fall below the moving averages; further dropping could bring it towards the lower boundary of the channel to meet the nearest support levels of 800 SAT and 600 SAT. Meanwhile, the technical indicator RSI (RSI) is moving into the overbought region, which may likely suggest more bullish signals.
Join Our Telegram channel to stay up to date on breaking news coverage