Join Our Telegram channel to stay up to date on breaking news coverage
XRP Price Prediction – January 6
XRP/USD bulls have been trying to break above the 9-day MA but the price has been rejected from several potential resistance levels.
XRP/USD Market
Key Levels:
Resistance levels: $0.40, $0.45, $0.50
Support levels: $0.045, $0.005, -$0.050
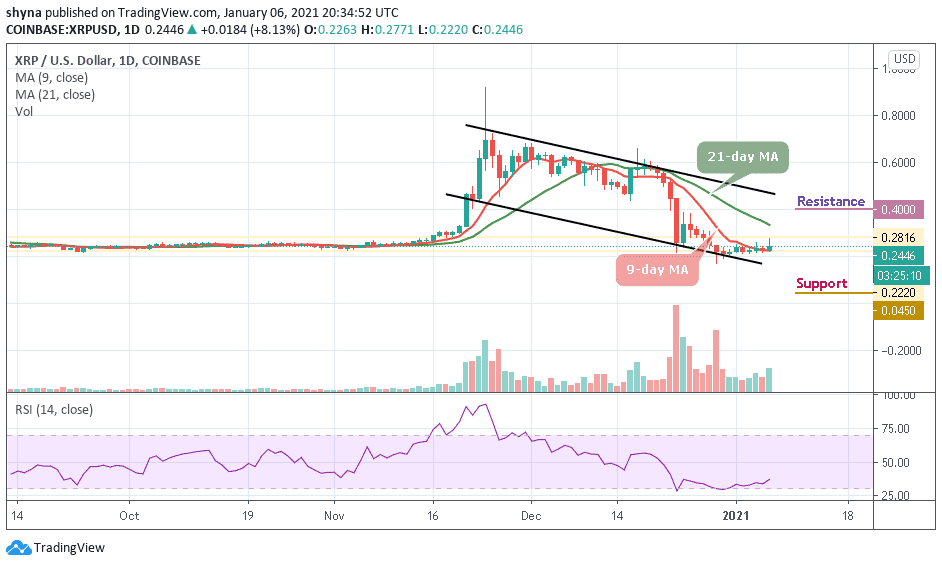
According to the daily chart, we can observe a sideways movement for XRP/USD. The 9-day moving average has been acting as support even though the price has not been able to climb above it several times. However, should in case the bulls want to see a shift in momentum, they will need to hold the price above the moving averages, convert both into support levels and continue trading upwards until they create a bull cross.
What to Expect from Ripple (XRP)
Ripple (XRP) is currently trading at $0.244 and any attempt below the 9-day MA and lower boundary of the channel could open the door to drop further and the price could fall below the $0.15 support level. However, the traders need to keep an eye on the $0.30 before moving upwards while the resistance levels lie at $0.40, $0.45, and $0.50.
Moreover, the market may experience a quick-buy as soon as the market price moves above the 21-day MA. And if the price fails to rebound, then a bearish breakout is likely to trigger more selling opportunities for traders, which might cause the price to retest $0.045 and could further drop to $0.005 and -$0.050 support levels respectively. The RSI (14) is trying to recover from the downside; XRP/USD may follow a bullish trend.
When compares with Bitcoin, the situation is becoming bleak as the market trades below the 9-day and 21-day moving averages. The XRP/BTC has not been able to break above 9-day MA. The market opens today with a downtrend where it touches the daily low of 0638 SAT.
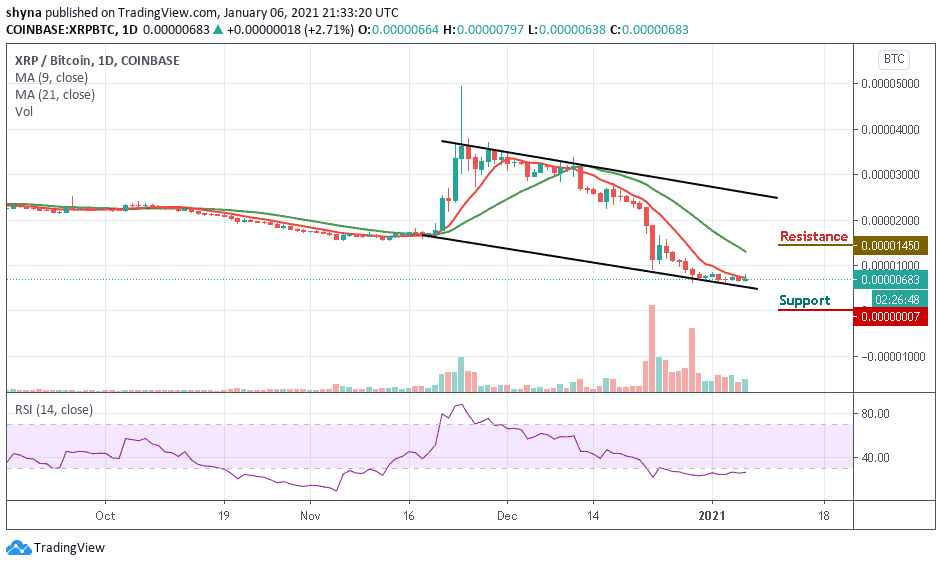
However, looking at the daily chart, the bears may be stepping back into the market and could bring the price back below the lower boundary of the channel at the nearest support levels at 0007 SAT and below. Meanwhile, the RSI (14) may remain in the oversold region, which indicates that the bearish movement may continue to play out.
Join Our Telegram channel to stay up to date on breaking news coverage