Join Our Telegram channel to stay up to date on breaking news coverage
Bitcoin (BTC) Price Prediction – January 6
Bitcoin is seen surging higher as the cryptocurrency is currently trading around the $35,012 resistance level.
BTC/USD Long-term Trend: Bullish (Daily Chart)
Key levels:
Resistance Levels: $38,600, $38,800, $39,000
Support Levels: $30,700, $30,500, $30,300
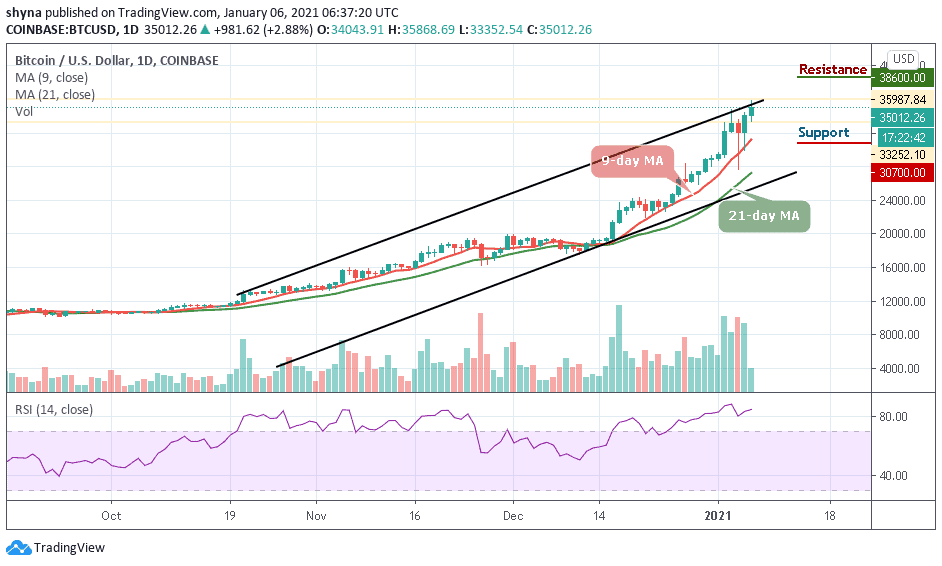
BTC/USD has been able to surpass $35,000 as the coin is seen trading above the 9-day and 21-day moving averages. Now, the next important target may be at around $38,000, where Bitcoin has usually experienced heavy resistance from sellers. Thus, the Bitcoin (BTC) touches the daily high of $35,868 as the market opens today and it seems to be gaining some stability according to the daily chart.
Will BTC Break Through Resistance Level $36,000 or Reverse?
Bitcoin (BTC) is now trading around $35,012 and it has a market valuation of $663 billion. After several weeks of being traded between $30,000 and $34,000, Bitcoin has been able to clearly break above $35,000 and reach a price per coin of $35,868. The main question is whether it will be able to surpass $38,000 where it may usually find large resistance. Meanwhile, traders are now waiting for a continuation of the bull trend that would help Bitcoin reach new highs.
Moreover, for Bitcoin to would have reached $38,000, this could be the beginning of a new bull run in the crypto space. More so, as the RSI (14) is soaring within the overbought region, BTC/USD may soon hit the potential resistance levels at $38,600, $38,800, and $39,000 while sliding below the moving averages could drag the price to the critical support levels of $30,700, $30,500, and $30,300 respectively.
BTC/USD Medium-term Trend: Bullish (4H Chart)
Looking at the 4-hour chart, BTC/USD is seen retreating after touching the daily high at $35,868. Today’s price move happens to be the most impressive one as it keeps climbing above the moving averages with a sharp surge. However, BTC/USD is now maintaining its bull-run above $35,400 as the RSI (14) moves into the overbought region.
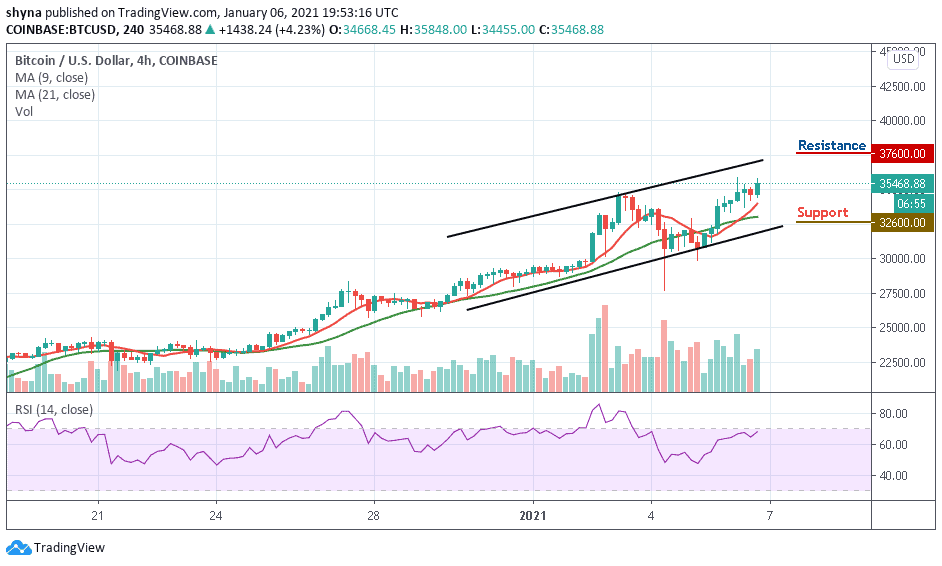
In other words, BTC/USD may likely take a downward move if the bulls failed to push more. However, the coin could breach the nearest support at $33,500 to reach the support level of$32,600 and below. More so, if bulls find a decent support around $34,000, the bulls may continue its uptrend by crossing above the channel to hit another resistance at $37,600 and above.
Join Our Telegram channel to stay up to date on breaking news coverage