Join Our Telegram channel to stay up to date on breaking news coverage
XRP Price Prediction – August 28
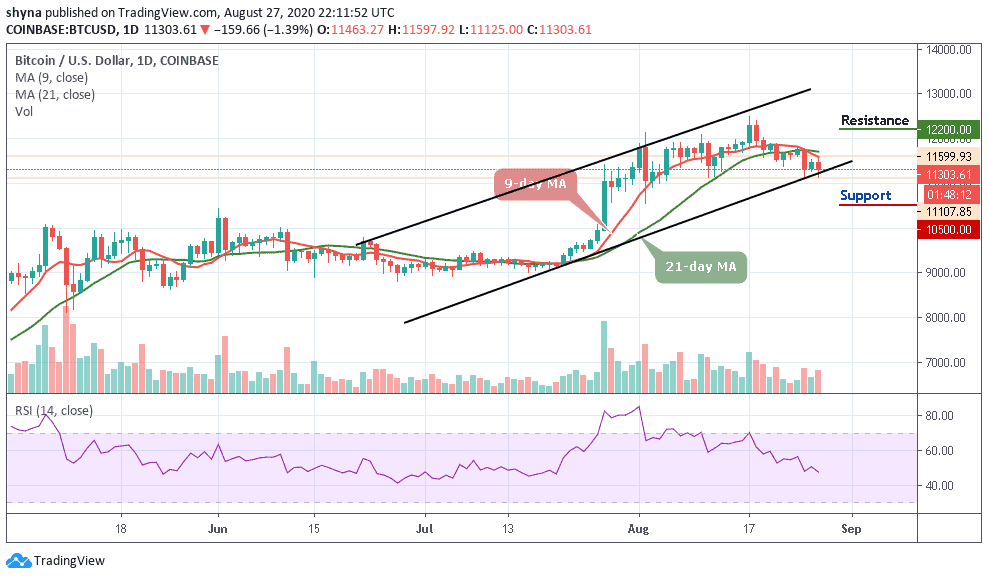
The daily chart reveals today that most of the gains from the uptrend are now gone with XRP/USD losing a significant portion of its dominance.
XRP/USD Market
Key Levels:
Resistance levels: $0.30, $0.32, $0.34
Support levels: $0.23, $0.21, $0.19
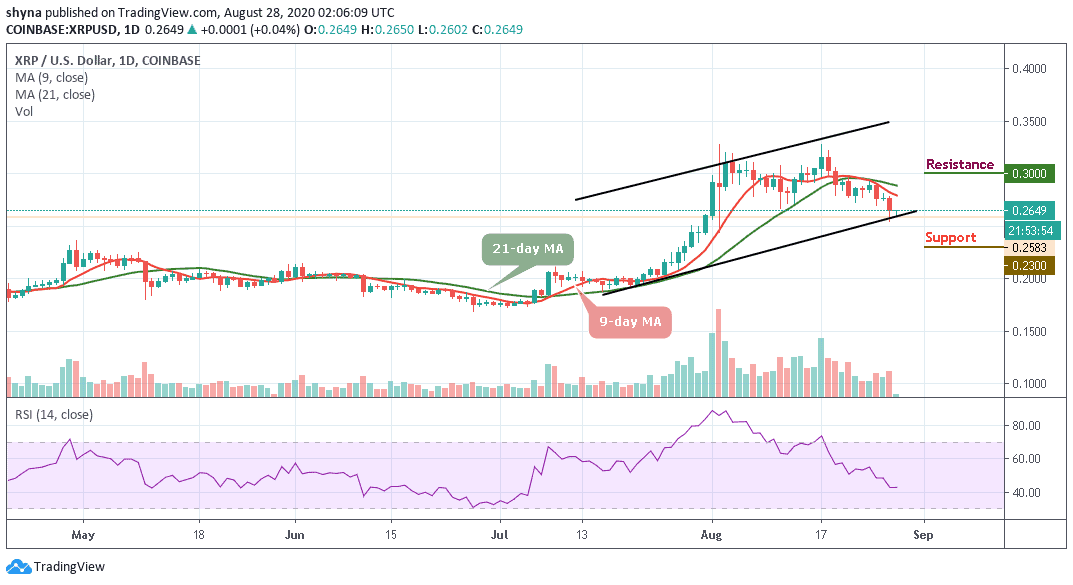
According to the daily chart, XRP/USD is now down at a low not seen since July 2020. The weakness of Ripple (XRP) is quite apparent now as the digital asset will have very little support on the way down to $0.24. Traders should take note that most of the market is also seeing red numbers, major coins have been holding on quite well. XRP bulls will now need to see a bounce from any support level to have any chance to recover its daily uptrends.
What is the Next for Ripple (XRP)
Looking at the daily chart, should in case the Ripple (XRP) fails to climb above the $0.280 and $0.2950 resistance levels, there could be a bearish reaction. Initial support is near the $0.250 level and the channel’s lower trend line. If there is a downside break below the channel support, the price could test $0.240. Any further losses might start another bearish wave and the price could even decline below the $0.23, $0.21, and $0.19 support levels.
However, as the technical indicator RSI (14) remains within the 43-level, the nearest resistance is near the $0.290 level, above which the price might cross above the 9-day and 21-day moving averages may likely hit the potential resistance levels at $0.30, $0.32, and $0.34 respectively.
Against Bitcoin, the decline has continued and all support at the 2400 SAT has broken down. The price is set to test 2200 SAT if Bitcoin (BTC) continues to impact the XRP price. The bearish scenario remained dominant within the channel as the sellers continued to put pressure on the market.

In addition, if the sellers occupy their positions, the XRP may drop to the support level of 2100 SAT and below. At present, the RSI (14) is currently trading at above 40-level, this could give the bulls another chance to push the coin above the 9-day and 21-day moving averages. Any further bullish movement could hit the resistance levels at $2600 and above.
Join Our Telegram channel to stay up to date on breaking news coverage