Join Our Telegram channel to stay up to date on breaking news coverage
Bitcoin (BTC) Price Prediction – August 27
BTC/USD is currently around $11,303 after a failed attempt by the bulls to climb above $11,600.
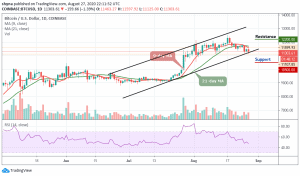
BTC/USD Long-term Trend: Ranging (Daily Chart)
Key levels:
Resistance Levels: $12,200, $12,400, $12,600
Support Levels: $10,500, $10,300, $10,100

Today, BTC/USD is declining, trading at $11,303. It is correcting after several attempts to grow and renew the peaks. If Bitcoin fails to recover above the $11,400 and $11,550 level, there is a risk of more losses. The first key support is near the $10,800 level. The main support is now forming below the 9-day and 21-day moving averages, which there is a risk of a sharp decline. In the stated case, the price might continue to move down towards the $10,500, $10,300, and $10,100 support levels.
What to Expect from Bitcoin (BTC)
At the moment, the price is holding marginally below the moving averages on the daily chart. BTC/USD needs a boost at this level in order to take down the short term resistance at $11,400. Gains above $11,500 and the moving averages at $11,800 would most likely encourage more buyers to join the market as confidence in the recovery mounts. For now, holding above this level is the key to establishing support and balance before attempts are made to clear the hurdles towards $12,000.
Nevertheless, for the longer term, as long as BTC/USD maintains the $11,597 previous high, we can say the market is bullish in the long term. Meanwhile, the pair must break the $11,600 level to move into a positive zone. The nearest resistance levels are located at $12,200, $12,400, and $12,600 while the RSI (14) is seen moving below 50-level, suggesting more bearish levels.
BTC/USD Medium – Term Trend: Bearish (4H Chart)
The 4-hour chart reveals that the Bitcoin price is still under $11,500, the market price may continue to weaken if the price drops below $11,000. Further bearish movement may likely reach other supports at $10,800 and $10,600 respectively.
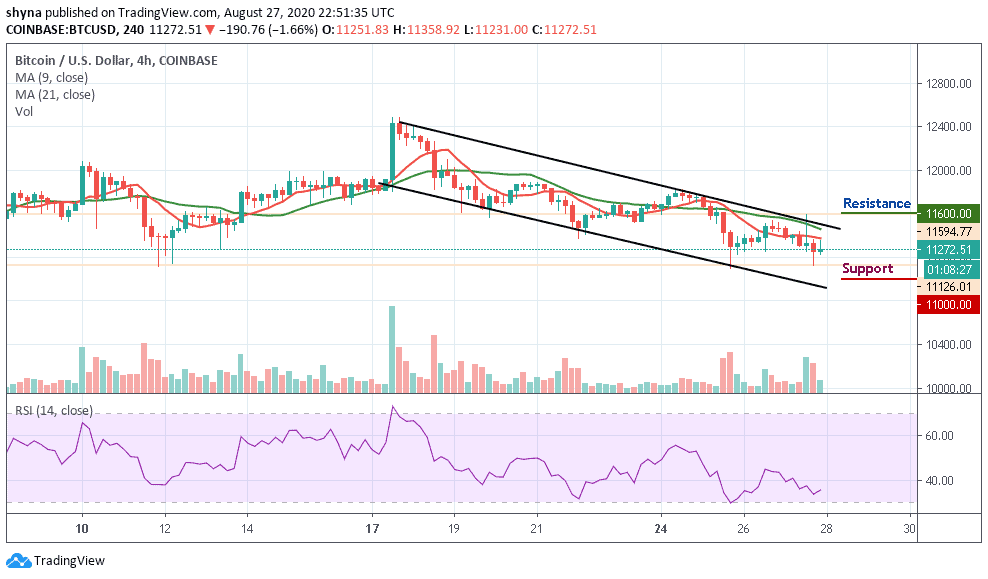
Moreover, as the technical indicator RSI (14) is recovery above the 30-level, the Bitcoin price may experience bullish movement which may cross above the moving averages. Meanwhile, further resistance of $11,600 and $11,800 could be revisited if the bulls put more effort.
Join Our Telegram channel to stay up to date on breaking news coverage