Join Our Telegram channel to stay up to date on breaking news coverage
XRP Price Prediction – November 22
The Ripple (XRP) is currently pushing higher with 1.96% gains as the coin manages to climb above the $0.50 level.
XRP/USD Market
Key Levels:
Resistance levels: $0.53, $0.52, $0.51
Support levels: $0.38, $0.37, $0.36
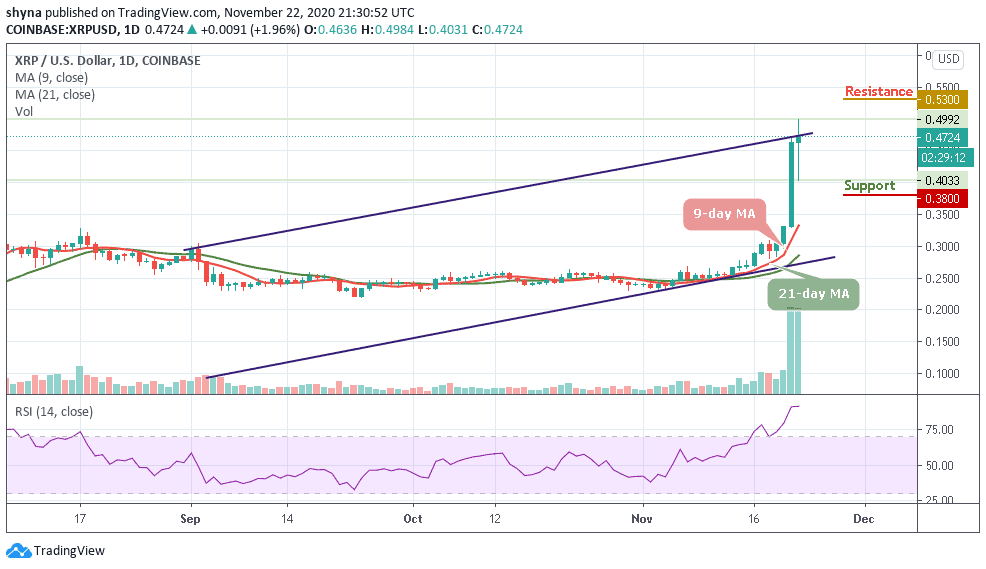
Today, XRP/USD manages to reach a high of around $0.498 as the market moves above the upper boundary of the channel. A few weeks ago, Ripple was seen trading sideways. Meanwhile, the push higher today allows XRP/USD to hit its highest level since June 2019. This bounce above the 9-day and 21-day moving averages shows that the buyers are now in control of the market momentum moving forward.
What to Expect from XRP?
If the XRP bulls want to maintain the upward momentum, they need to hold the price above the channel and they will need to convert both the 9-day and 21-day moving averages into support levels and continue trading upwards until they stay above the channel. A bullish breakout above this barrier could take the Ripple price up to the potential resistance levels of $0.53, $0.52, and $0.51 as the RSI (14) remains within the overbought zone.
Moreover, XRP/USD is trading at $0.472 after touching the daily high at $0.498. In other words, a drop beneath the $0.040 may cause the Ripple price to spiral downward and head beneath the $0.39 level. On the downside, the local support may be created on approach to $38. If it is broken, the sell-off may be extended to critical supports at $0.37 and to psychological $0.36 respectively.
When compares to Bitcoin, Ripple (XRP) is still demonstrating some positive signs across the market. The trend is perpetually looking bullish in the long-term and moving within the ascending channel. It is currently changing hands at 2524 SAT after witnessing some bearish moment last few weeks.
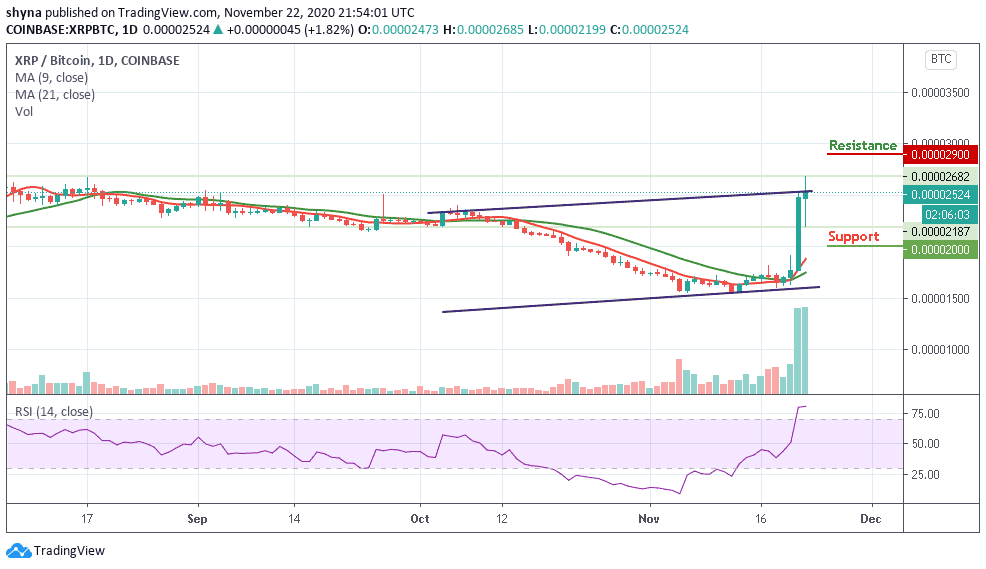
However, the resistance levels are located at 2900 SAT and above but any bearish movement towards the moving averages may hit the closest support levels at 2000 SAT and below. The RSI (14) is moving within the overbought zone, suggesting a sideways movement for the market.
Join Our Telegram channel to stay up to date on breaking news coverage