

Join Our Telegram channel to stay up to date on breaking news coverage
XRP Price Prediction – November 14
Ripple (XRP) faces the south but further increase in the bears’ pressure may decrease the Ripple price and it may reach $0.25 in case the $0.26 resistance fails.
XRP/USD Market
Key Levels:
Resistance levels: $0.28, $0.29, $0.30
Support levels: $0.25, $0.24, $0.23
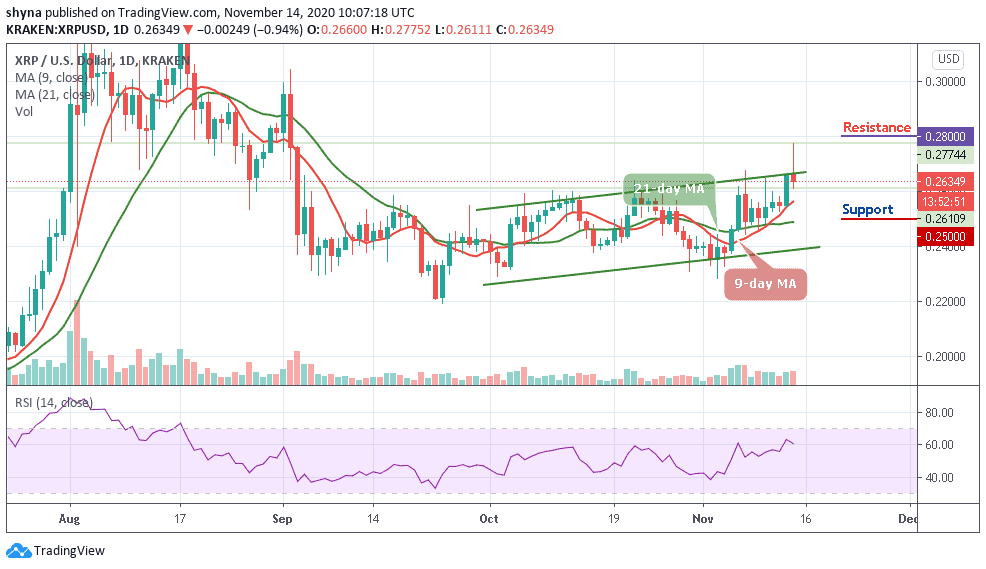
XRP/USD is seen correcting downwards after touching the resistance at $0.277. However, given the large narrowing in price action, a breakout could very well be explosive for the coin as the price moves above the 9-day and 21-day moving averages. The Ripple’s price is changing hands at $0.263 within the channel.
What to expect from Ripple (XRP)
The Ripple bulls are expected to perform these important things to keep the uptrends; the first is to hold onto the support at $0.26 as this will help shift the attention back to $0.27 resistance. Secondly, buyers must focus their effort on breaking above the bullish flag pattern in anticipation of a rally massive enough to boost action above $0.27. Thirdly, the on-going retreat from the upper boundary of the channel must be controlled to ensure that losses under $0.26 do not nullify the progress made in the last few weeks.
Meanwhile, the RSI (14) is currently facing the south to cross below the 40-level. However, if the bears continue with the current movement and push the price below the 9-day moving average; XRP/USD could find its low at the support levels of $0.25, $0.26, and $0.27 respectively. Nevertheless, if the price breaks above the channel, it may likely hit the resistance levels of $0.28, $0.29, and $0.30.
When compares with Bitcoin, XRP is trading on the downside, although the price is maintaining the bullish movement within the 9-day and 21-day moving averages. If the buying pressure persists, the XRP price variation may likely create a new high in the next few days as the RSI (14) leaves the oversold region; traders may see a positive move in the market soon.
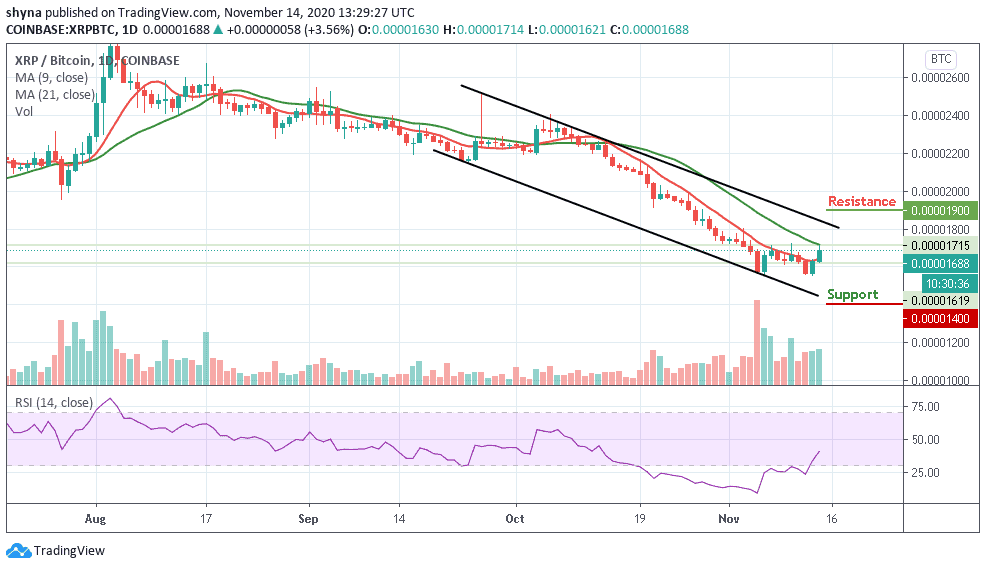
However, the coin remains at the downside of the descending channel. We can expect close support at the 1500 SAT before breaking to 1400 SAT and below. If a bullish move continues and breaks above the moving averages, traders can confirm a bull-run for the market, and the potential resistance level is located above the channel at 1900 SAT and above.
Join Our Telegram channel to stay up to date on breaking news coverage
