

Join Our Telegram channel to stay up to date on breaking news coverage
Bitcoin (BTC) Price Prediction – November 14
The Bitcoin price is poised for a retreat to the next support at $15,500 before making another breakout above $17,000 resistance.
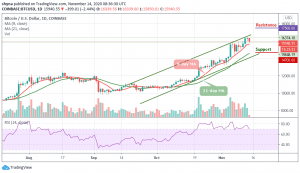
BTC/USD Long-term Trend: Bullish (Daily Chart)
Key levels:
Resistance Levels: $17,500, $17,700, $17,900
Support Levels: $14,700, $14,500, $14,300

BTC/USD has been able to rise above the stubborn resistance at $16,600. However, there was an impressive bullish price action over the week that saw the Bitcoin price draw closer to $16,500. Unfortunately, at the opening of today’s trading, the bullish case is been cut short, leaving a gap that has been explored by the bears. BTC/USD is currently refreshing support at $15,850 after which bulls took another shot to hit a barrier at $15,940.
Where is BTC Price Going Next?
The Bitcoin (BTC) is trading at 15,940 even as bulls seek support above $15,800. Looking at the technical indicator RSI (14), the first digital asset is still in the hands of the bulls. However, a minor retreat made by the RSI (14) making an attempt to leave the overbought zone suggests that exhaustion is slowly engulfing the bullish tent and whatever direction it chooses would determine the next level for the king coin.
Nevertheless, if BTC/USD delays the run-up to $17,000, sellers could eventually gain traction, sending the price back to $15,000 support. Meanwhile, if the support at $15,000 is shattered, BTC/USD may be forced to seek refuge in the next key supports at $14,700, $14,500, and $14,300. On the other hand, any bullish movement above the upper boundary of the channel may hit the potential resistance at $17,500, $17,700, and $17,900 respectively.
BTC/USD Medium – Term Trend: Bullish (4H Chart)
On the 4-Hour chart, the Bitcoin price is trading below the 9-day and 21-day moving averages at the $15,946 level. The price may likely fall below $15,500 if the bears fully stepped back into the market.
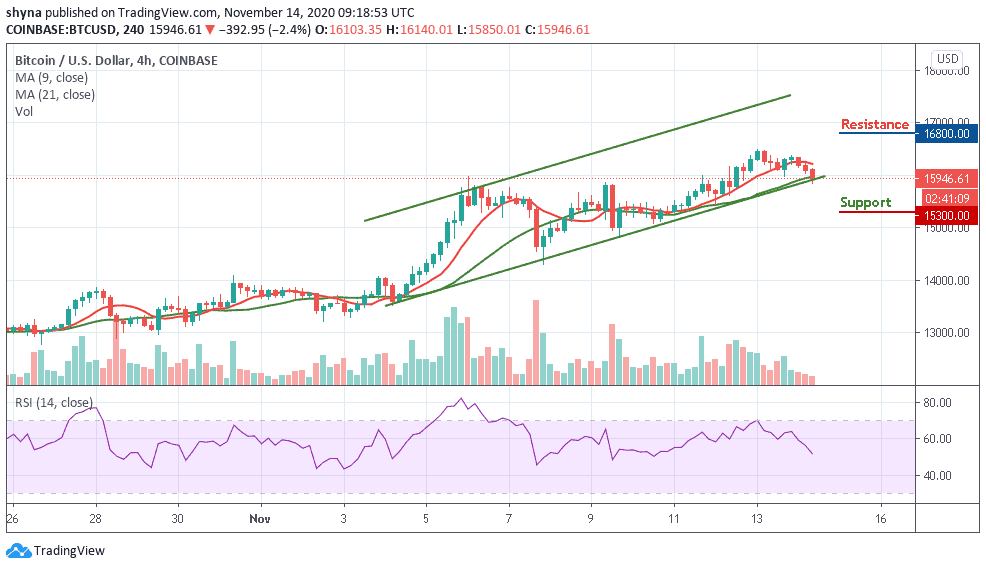
However, a further bearish movement could test the critical support at the $15,300 level and below while the resistance is located above the moving averages at the $16,800 and above. Technically, Bitcoin is currently following the bearish movement as the technical indicator RSI (14) moves below 52-level.
Join Our Telegram channel to stay up to date on breaking news coverage