Join Our Telegram channel to stay up to date on breaking news coverage
XRP Price Prediction – November 7
The Ripple (XRP) price fails to break out of a rising ascending channel as the price drops below the support of $0.250.
XRP/USD Market
Key Levels:
Resistance levels: $0.280, $0.285, $0.290
Support levels: $0.230, $0.225, $0.220
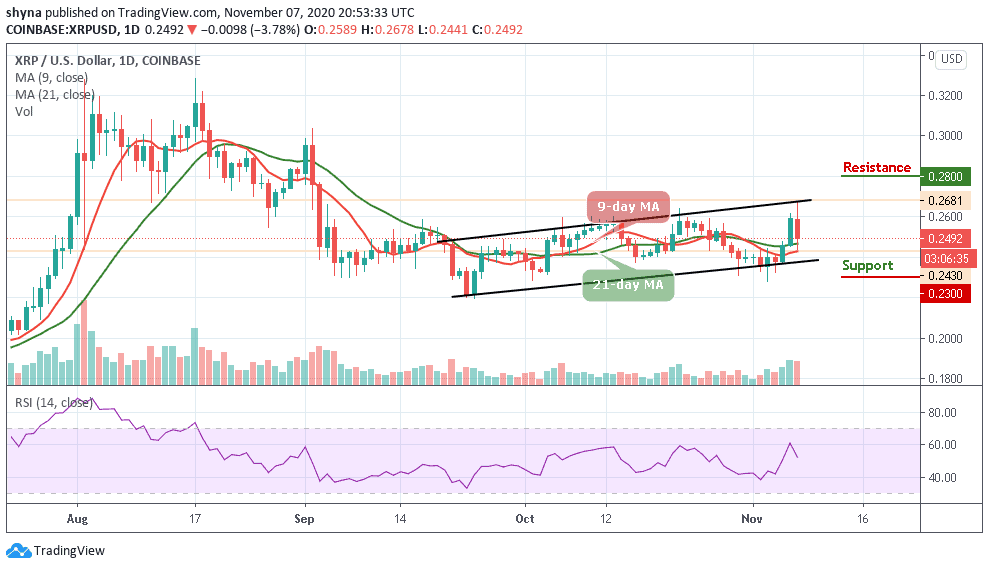
XRP/USD drops after touching the daily high of $0.267, the price absorbed stops located below $0.260 and slipped to $0.250 in a matter of hours. While the price has partially recovered the losses to trade at $0.249 with 3.78% lower from the beginning of the day. Meanwhile, XRP/USD needs to regain ground above $0.255 to mitigate the bearish pressure.
Where is XRP Price Going Next?
XRP/USD is currently changing hands at $0.249 and any attempt to make it cross below the 9-day and 21-day moving averages for more downsides, the Bitcoin price could spike below the lower boundary of the channel at $0.235 support before creating a new bearish trend at the support levels of $0.230, $0.225 and $0.220.
For the upside, the buyers may need to make a sustainable move above $0.250 as soon as possible to negate an immediate bearish scenario and improve the technical picture. Nevertheless, for the upside to gain traction, the coin needs to regain ground above $0.260, while $0.280 $0.285, and $0.290 resistance levels are the ultimate aims for the bulls.
More so, the technical indicator RSI (14) suggests that the market may likely follow the downward movements as the signal line moves below the 60-level.
Against Bitcoin, the Ripple (XRP) has been slowly grinding higher within the channel. The price begins to slowly ascend and is currently trading around the 1677 SAT. XRP’s price is now contained within the descending channel as traders wait for the bulls to hopefully push the price above the 9-day and 21-day moving averages.
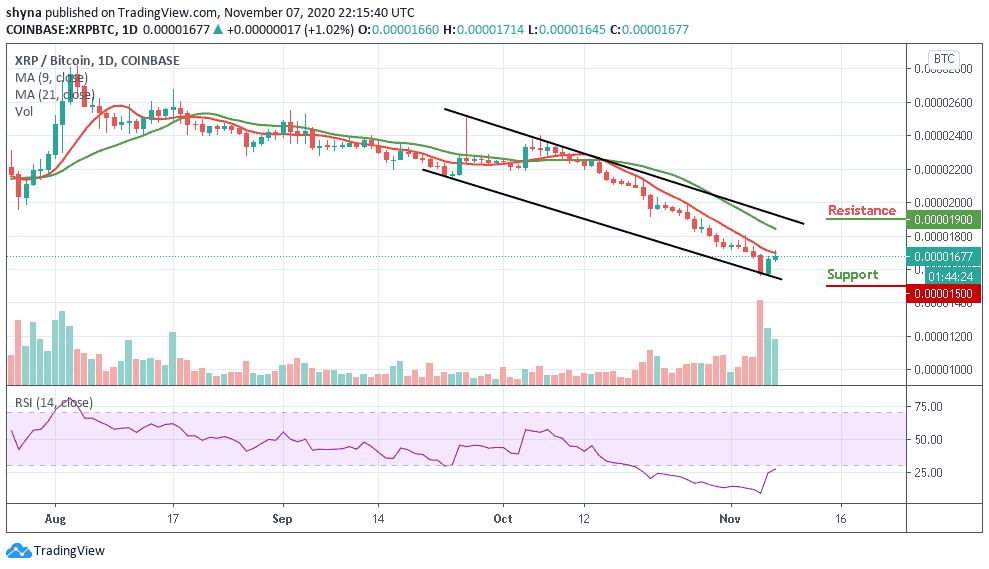
Moreover, if the bulls can break above the upper boundary of the channel, we can expect initial resistance at 1800 SAT. Above this, higher resistance lies at the 1900 SAT and above. From below: If the sellers push the market beneath the lower boundary of the channel, we can expect supports at 1500 SAT and below. The RSI (14) is within the oversold zone and is likely to follow an upward movement.
Join Our Telegram channel to stay up to date on breaking news coverage