Join Our Telegram channel to stay up to date on breaking news coverage
Bitcoin (BTC) Price Prediction – November 7
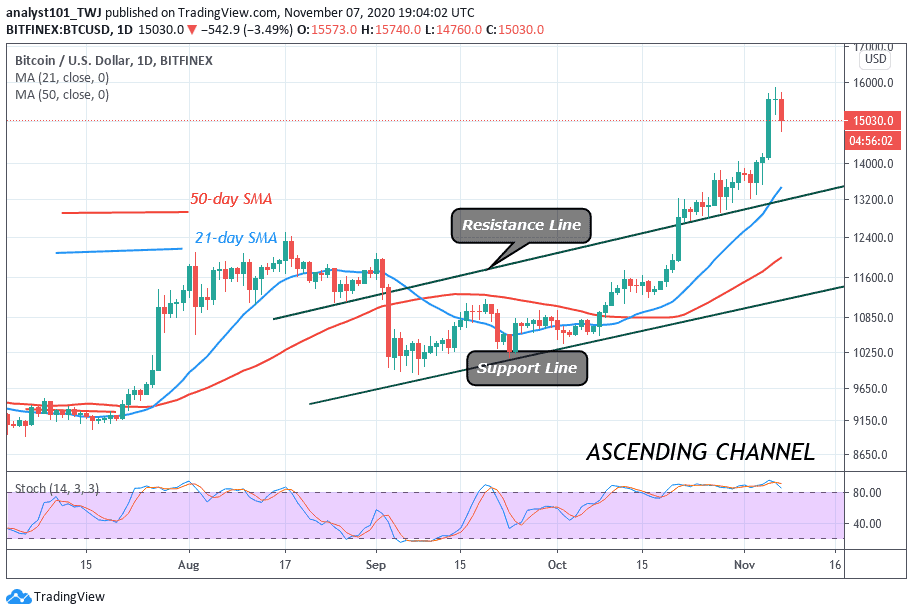
BTC/USD continues to consolidate underneath a $15,000 barrier and on top of critical support $14,500.
BTC/USD Long-term Trend: Bullish (Daily Chart)
Key levels:
Resistance Levels: $16,600, $16,800, $17,000
Support Levels: $14,000, $13,800, $13,600
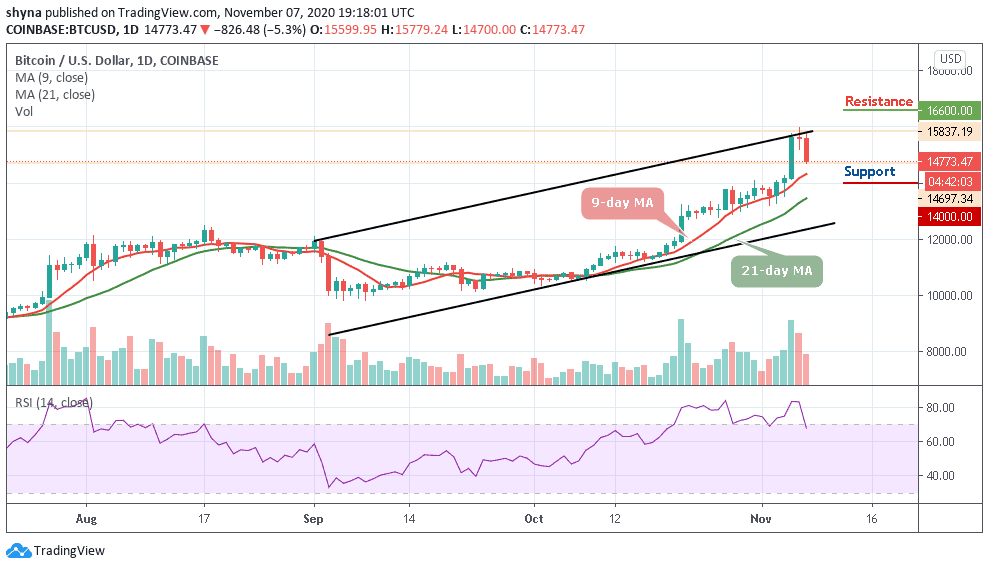
BTC/USD has maintained its price near the $16,000 mark from yesterday. Though the coin has been following the upward movement for the few weeks, this period, the price is now facing down with 5.3% in the value. It is likely to retain this bearish vibe in the near-term as the technical indicator moves below the 70-level, shifting focus from the overbought region. At the time of writing, the price of Bitcoin is hovering at $14,773.
Where is BTC Price Going Next?
Looking at the daily chart, the critical support at $14,500 may be tested to the downside as the price consolidates. Failure of the noted support would likely see the price crossing below the 9-day MA. This area is likely to slow down the correction and serve as a jumping-off ground for another recovery attempt; however, if it is out of the way, the support level of $14,000, $13,800, and $13,600 may come into focus.
However, BTC/USD recovers above $15,600 as the market opens today but the resistance at $15,779 still stands in the way of movements to $16,000. In the meantime, Bitcoin is trading at $14,773 amid a building bullish momentum. More so, BTC/USD is still fighting to correct the subtle bearish movement, and the bullish trend coupled with the right volume and high volatility level is the right ingredient for the recovery to $16,000 in other to resume its upward movement towards $16,600, $16,800, and $17,000 resistance levels.
BTC/USD Medium-Term Trend: Bearish (4H Chart)
Checking the 4-Hour chart, BTC/USD is currently trading below the 9-day and 21-day moving averages. Nevertheless, Bitcoin has not yet slipped below $14,200 and still in the loop of breaking or making a bounce back. BTC price hovers around $14,584 and may take time to persistently trade above $16,000. The upward movement may likely retest the $15,400 and $15,600 resistance levels if the bulls regroup again.
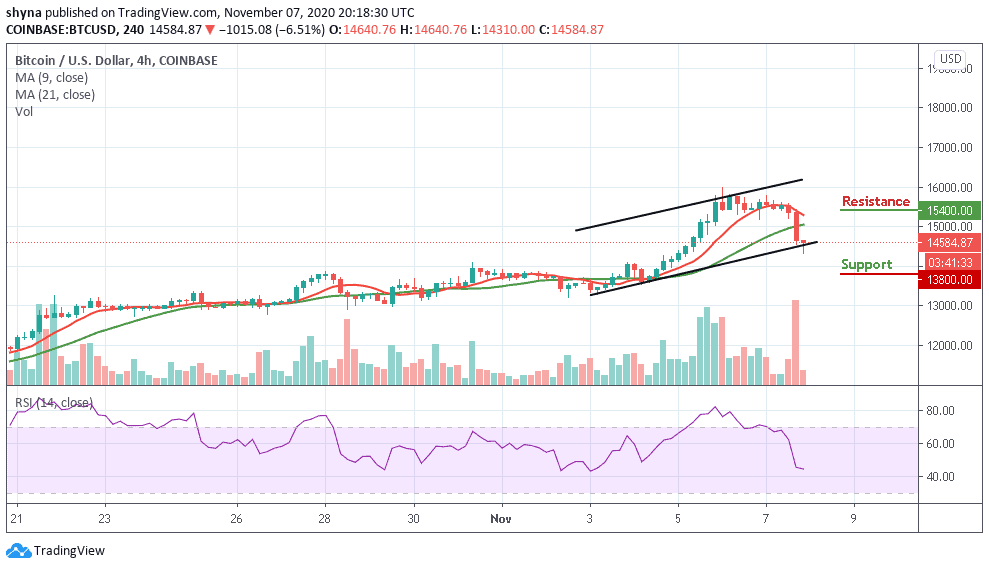
However, on the downside, the price could fall below $14,000 if the bears put more pressure into the market, a further movement could test the critical support at the $13,800 level and below. The RSI (14) moves below the 50-level, indicating a bearish movement.
Join Our Telegram channel to stay up to date on breaking news coverage