

Join Our Telegram channel to stay up to date on breaking news coverage
XRP Price Prediction – October 14
The Ripple (XRP) remains range-bound but can this latest bullish momentum break above the channel?
XRP/USD Market
Key Levels:
Resistance levels: $0.275, $0.285, $0.295
Support levels: $0.235, $0.225, $0.215
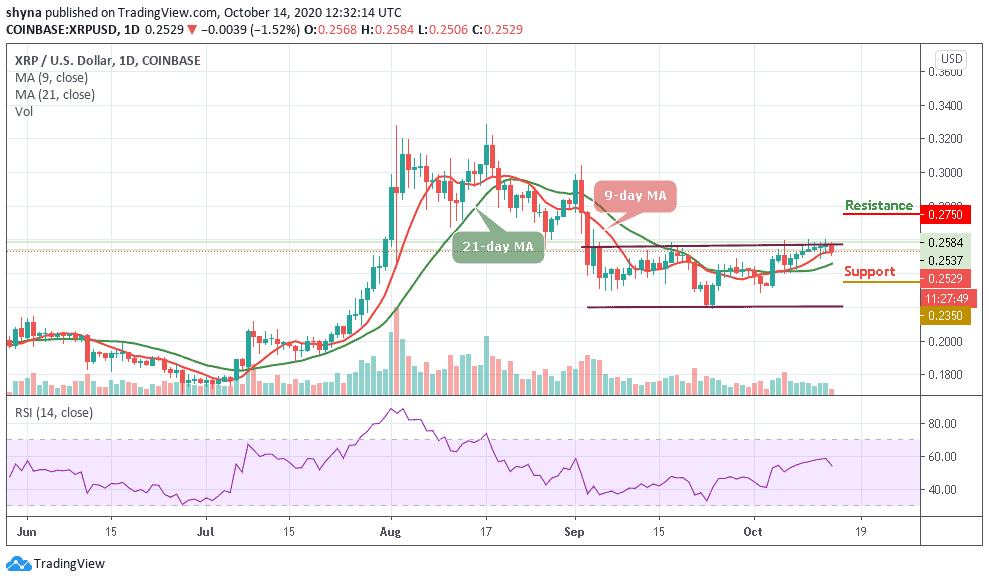
After touching the intraday high of 0.256, XRP/USD is currently trading above the 9-day and 21-day moving averages with a 1.52% loss over the past 24 hours of trading as it reaches the low of $0.250. The cryptocurrency has been bouncing around within a range between $0.220 and $0.260 since last month. A few days ago, XRP/USD has been maintaining the bullish trend, pushing the price above the moving averages.
What is the Next Direction for Ripple?
At the time of writing, XRP/USD is still struggling to continue above $0.256. It is currently trading within the channel with the nearest support at $0.250. If the price fails to stay above this support zone, it is likely to resume its decline. Meanwhile, as the RSI (14) nosedives below the 60-level, the first major support is near the $0.245 level while any further losses may perhaps start a significant decline towards the $0.235, $0.225, and $0.215 support levels.
Furthermore, for the coin to remain strong in the market, the bulls must keep the price above the moving averages. On the upside, an initial resistance is near the $0.260 level above the channel. But to start a new increase, XRP/USD must surpass the $0.265 and any further gains could lead the price towards the $0.275, $0.285, and $0.295 resistance levels.
When compared with Bitcoin, XRP is currently trading at 2215 SAT and it’s trading under the 9-day and 21-day moving averages. If the above-mentioned level could serve as market support, the price may likely cross above the channel and move towards the resistance level of the 2300 SAT. By reaching this level, the price could then visit 2350 SAT and above.
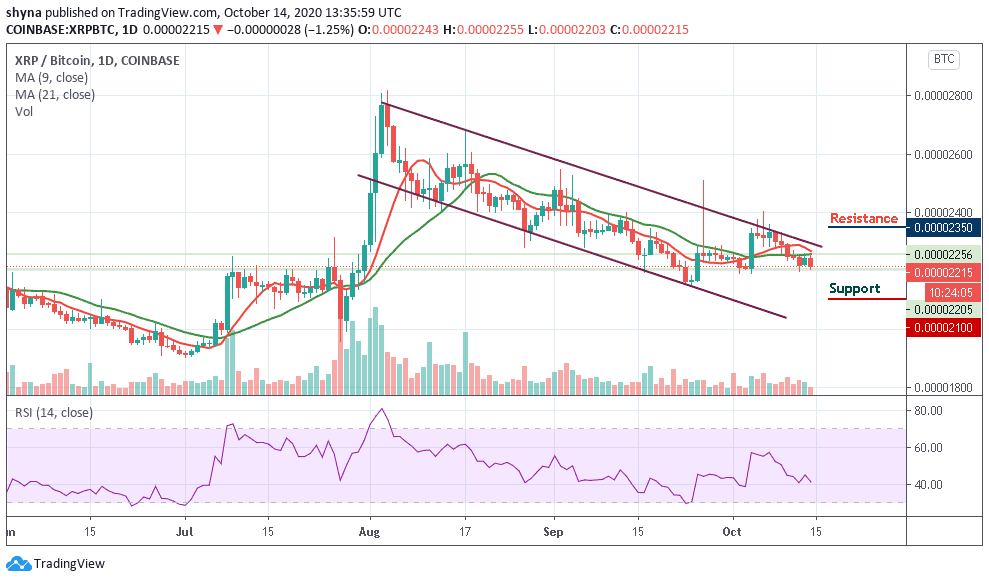
However, if the bulls fail to push the price upward, the market may begin a downtrend and the pair could probably record further declines at 2150 SAT. Breaking this level could push the market to the nearest support levels, at 2100 SAT and below. Meanwhile, the RSI (14) is moving to cross below 40-level, which may possibly give more bearish signals in the nearest term.
Join Our Telegram channel to stay up to date on breaking news coverage
