Join Our Telegram channel to stay up to date on breaking news coverage
Bitcoin (BTC) Price Prediction – October 14, 2020
About 48 hours ago, the BTC price rebounded to break the resistance at $11,500 but it reached a new high of $11,609. However, the crypto has been retracing after attaining the recent high. BTC retraced to the support above $11,300 to resume a fresh uptrend.
Resistance Levels: $10,000, $11, 000, $12,000
Support Levels: $7,000, $6,000, $5,000

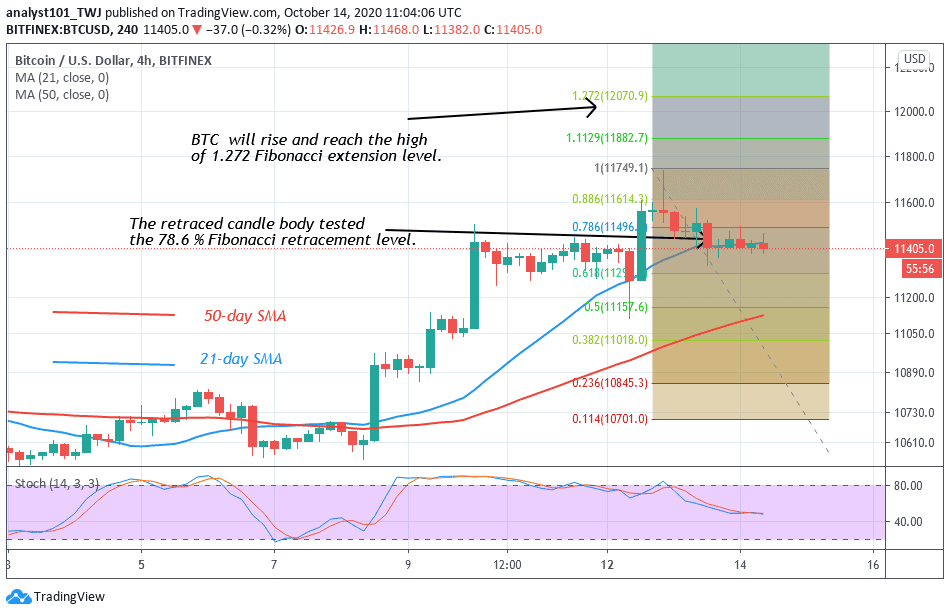
BTC/USD has continued to sustain above the critical support zones of $11,100, $11,200 and $11,300. Before the breaking of the $11,000 resistance, the coin has been fluctuating between $10,200 and $11,000. The coin rebounded above $10,886 support to break the $11,000 resistance. After the rebound, buyers push the coin to a high of $11,505. After two days of a sideways move below the recent high, BTC rebounded again to break the $11,500 resistance and reached the high of $11,609.
BTC price has been retracing after attaining the high of $11,609. In a nutshell, Bitcoin’s price has been making a series of higher highs and higher lows as it approaches the overhead resistance. On the upside, BTC is likely to make higher highs by rebounding above the current support. The coin is likely to rebound to reach a high of $11800 or $12,000 overhead resistance.
Bitcoin Indicator Reading
The 21-day and the 50-day SMAs are sloping upward indicating the uptrend. The moving averages have made a bullish crossover as the 21-day SMA crosses above the 50-day SMA. This indicates a buy signal. In the meantime, BTC is below the 50% range of the daily stochastic. It indicates that the coin is in a bearish momentum.

From the price action, Bitcoin is gradually moving up to the previous highs. On October 12 uptrend, BTC broke the $11,500 resistance level but the uptrend could not be sustained. The retraced candle body tested the 78.6% Fibonacci retracement level. This gives us the clue that the BTC price will rise and reach a high of 1.272 Fibonacci extension level. That is, a high of $12,070.90.
Join Our Telegram channel to stay up to date on breaking news coverage

