Join Our Telegram channel to stay up to date on breaking news coverage
XRP Price Prediction – October 11
The Ripple bulls continue to maintain the uptrend as the coin remains above the moving averages.
XRP/USD Market
Key Levels:
Resistance levels: $0.28, $0.29, $0.30
Support levels: $0.23, $0.22, $0.21
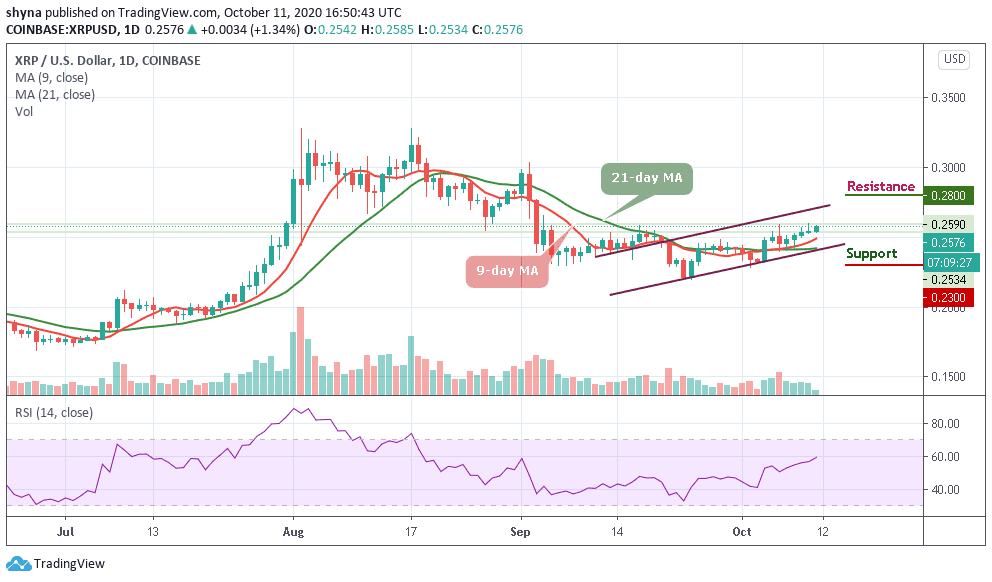
XRP/USD is currently hovering at $0.257 and it is struggling to break above the ascending parallel channel. The daily chart reveals that the Ripple price jumps from $0.253 to touch an intraday high at $0.258. At the time of writing, the pair retains the bullish momentum as the XRP/USD keeps trading above the 9-day and 21-day moving averages.
What to Expect from Ripple (XRP)
The Ripple (XRP) is currently making a gain of 1.34% at the time of writing and if the buyers maintain the upward movement, the price may likely cross above the upper boundary of the channel which could cause the price to hit the potential resistance levels of $0.28, $0.29, and $0.30
On the contrary, if the price drops below the moving averages, the pair is likely to locate the $0.024 support, which is a close support level for the bears. More so, a bearish continuation may bring the market to the critical supports at $0.023, $0.22, and $0.21 respectively. Meanwhile, the technical indicator RSI (14) is seen moving towards the 60-level, suggesting more bullish signals.
Comparing with Bitcoin, for the past 3days, Ripple (XRP) fell drastically until today when the bull takes over. At the time of writing, the bulls maintain an upward trend as the price moves above the 21-day MA. Now that the bull appears to be stepping back in the market, traders can now expect the price-rise to 2380 SAT and above if the coin crosses above the channel.
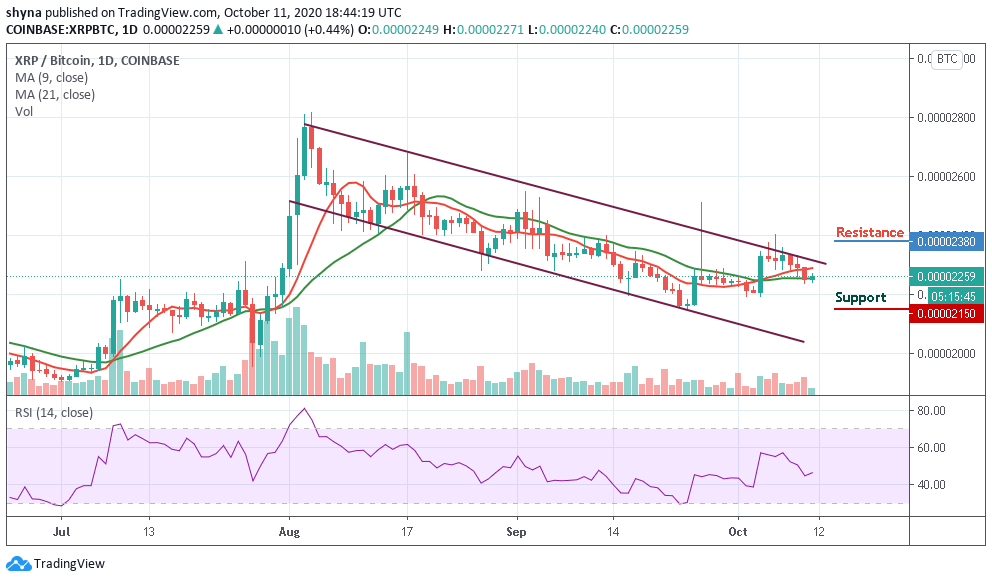
However, if the sellers reclaim back the control of the market and pull the price back below the moving averages, the next level of support is located at 2200 SAT and further support is found at 2150 SAT and above. The RSI (14) is moving around 46-level in order to give more strength to the buyers.
Join Our Telegram channel to stay up to date on breaking news coverage