Join Our Telegram channel to stay up to date on breaking news coverage
Bitcoin (BTC) Price Prediction – October 11
Bitcoin is seen surging higher after weeks of consolidation as the cryptocurrency is currently trading around $11,301 resistance level.
BTC/USD Long-term Trend: Bullish (Daily Chart)
Key levels:
Resistance Levels: $11,900, $12,100, $12,300
Support Levels: $11,000, $10,800, $10,600
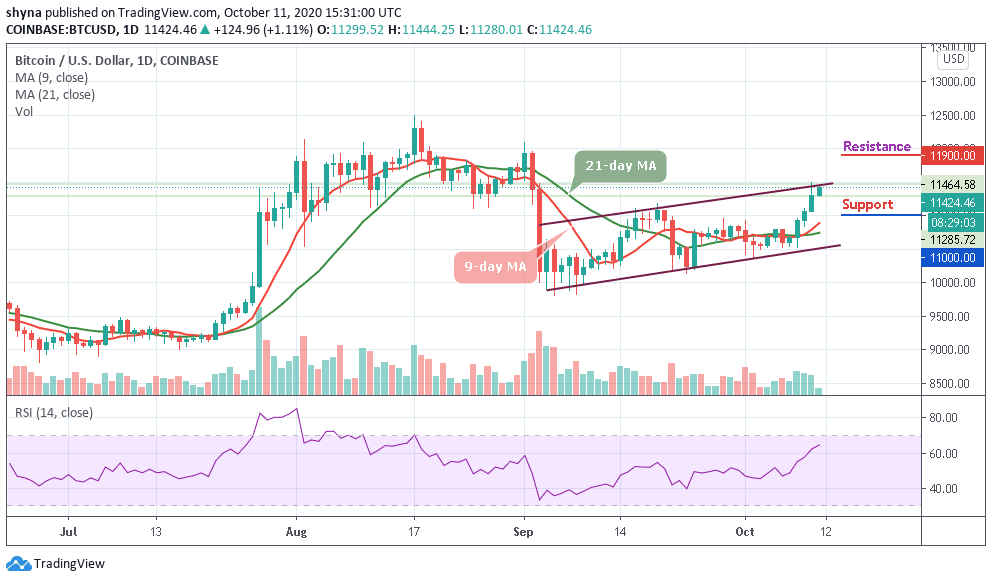
BTC/USD is currently soaring above $11,000 as one can say that this particular weekend belongs to the bulls as they not only pushing the Bitcoin price above $11,000 but also sustaining it above this crucial resistance. As it stands now, the king coin has clearly recovered from its October lows. However, the past four weeks saw muted price action as the bulls prevented any further slide in BTC/USD pair and undertook accumulation that ultimately helped break the $11,000 resistance.
Will BTC Break Through Resistance Level $11,700 or Reverse?
Currently, the price hovers around the $11,424 mark after touching a high of $11,444 today. The relentless buying action is fuelled by both short-term traders and long-term traders. The Bitcoin price has jumped over 5% in the past week, with the hottest activity occurring in the past four days alone. The daily chart reveals that the bulls are having the upper hand due to high liquidity and optimistic technical indicator RSI (14) as it moves above the 60-level.
Moreover, in as much as the 9-day MA keeps hovering above the 21-day MA, BTC/USD may continue with the upward movement. However, any further bullish movement above the channel may likely push the coin towards the potential resistance levels at $11,900, !2,100, and $12,300. But if the coin slide below the moving averages, it may likely hit the support levels at $11,000, $10,800, and $10,600 respectively.
BTC/USD Medium-term Trend: Bullish (4H Chart)
On the 4-hour chart, a retest of $11,400 gives the impression that the bulls are not yet done. The Bitcoin price rises to fill a significant gap as the bulls remained in control which may take the coin towards the $11,600. In a short time, BTC/USD may hit $12,000 if the bullish pressure continues. Otherwise, the price may revisit the supports of $11,100 and below.
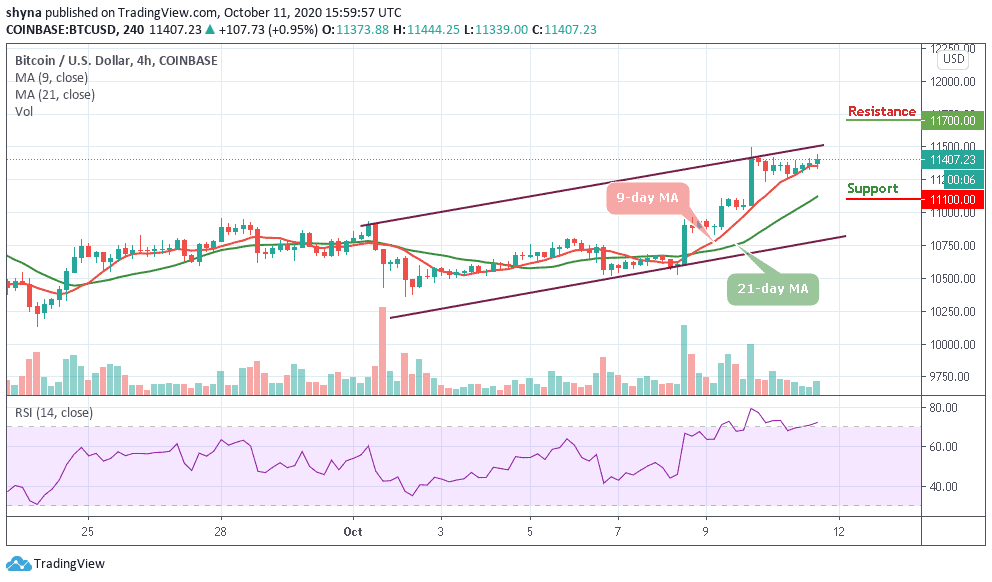
On the upside, a bullish move may continue to meet resistance at around $11,700 and above. As of now, the technical indicator RSI (14) is moving within the overbought, this could mean that the BTC/USD trading is looking for another close resistance. Meanwhile, a significant cross below the 9-day MA may send the market in a bearish scenario.
Join Our Telegram channel to stay up to date on breaking news coverage