Join Our Telegram channel to stay up to date on breaking news coverage
XRP Price Prediction – October 6
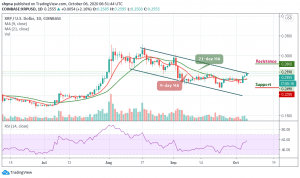
The Ripple (XRP) is currently pushing higher with 2.16% gains as the cryptocurrency manages to reclaim the $0.25 level.
XRP/USD Market
Key Levels:
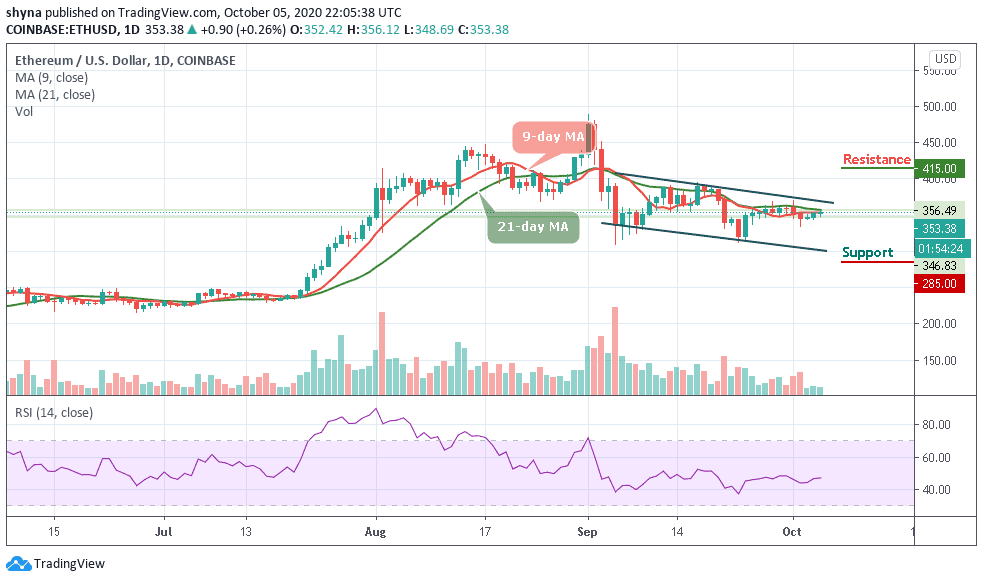
Resistance levels: $0.28, $0.29, $0.30
Support levels: $0.22, $0.21, $0.20

Looking at the daily chart above, we can see that XRP/USD manages to reach a high of around $0.259 as the market opens today. A few weeks ago, Ripple was seen trading sideways as it bounced between $0.220 and $0.252. Meanwhile, the push higher today allows XRP/USD to climb back above $0.25. This bounce above the 9-day and 21-day moving averages shows that the buyers are still battling to be in control of the market momentum moving forward.
Where is XRP Price Going Next?
If the XRP bulls want to see a shift in momentum, they will need to hold the price above the moving averages, convert both the 9-day and 21-day MAs into support levels and continue trading upwards until they create a bull cross above the upper boundary of the channel. The other resistance level is established at $0.25 but, the bulls aren’t facing a lot more resistance beyond that point. A bullish breakout above $0.25 could take XRP up to the potential resistance levels of $0.28, $0.29, and $0.30 as the RSI (14) moves to cross above the 60-level.
At the time of writing, XRP/USD is trading at $0.255 after holding above $0.250. In other words, a drop beneath the moving averages may cause the Ripple price to spiral downward and head beneath the $0.24 level. On the downside, the local support may be created on approach to $23. If it is broken, the sell-off may be extended to critical supports at $0.22, $0.21, and to psychological $0.20 respectively.
Against Bitcoin, Ripple (XRP) is still demonstrating some positive signs across the market. The trend is perpetually looking bullish in the long-term and moving within the descending channel. It is currently changing hands at 2331 SAT after witnessing some bearish moment last week.

However, the resistance levels are located at 2500 SAT and above but any bearish movement below the moving averages may hit the closest support levels at 2200 SAT and below. The RSI (14) is moving below 60-level, suggesting a sideways movement for the market.
Join Our Telegram channel to stay up to date on breaking news coverage