Join Our Telegram channel to stay up to date on breaking news coverage
ETH Price Prediction – October 5
Ethereum consolidates above $350 as the technical indicator RSI (14) confirms the sideways price action.
ETH/USD Market
Key Levels:
Resistance levels: $415, $420, $425
Support levels: $285, $280, $275

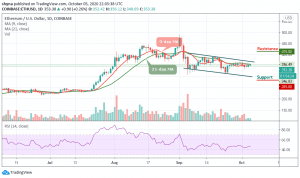
Following the dip on October 2, after touching the support at $195, ETH/USD bulls made a comeback, sending the price above $344. Since the position at the vital $352 level has been reclaimed by the bulls. The daily chart reveals that the Ethereum (ETH) has been strengthening its bullish case towards $360. The resistance at $356 has been a hard nut to crack but ETH/USD will need to push the market price above the 9-day and 21-day moving averages.
What Is the Next Direction for Ethereum (ETH)?
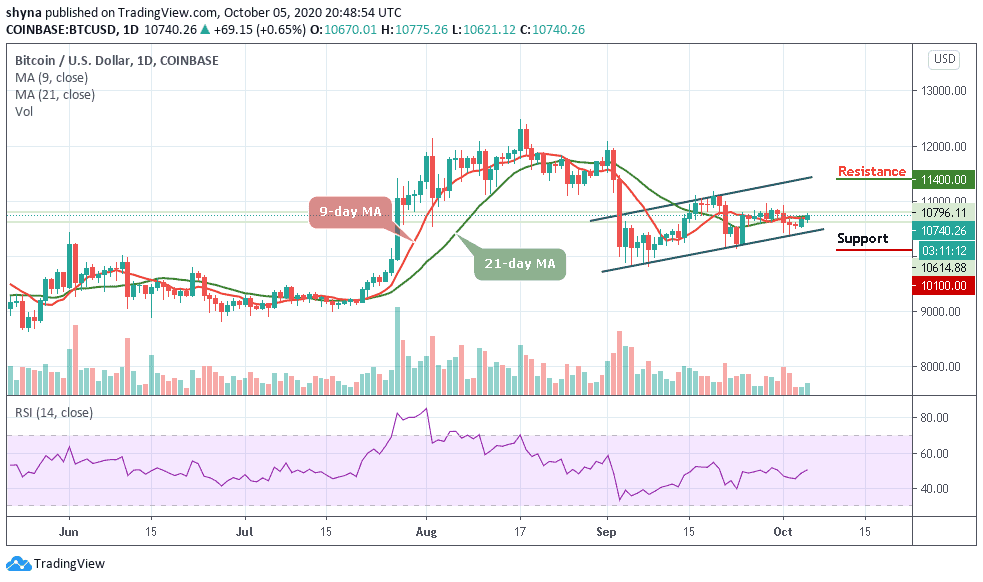
At the time of trading, ETH/USD is exchanging hands at $353 after surging only 0.26% on the day. The Bitcoin’s immediate upside is capped by the 21-day (MA) in the daily range. The intraday high is now the next resistance target likely to stand in the way of the recovery to $360. Meanwhile, the technical indicator RSI (14) recovers above 50-level could likely hint that Ethereum is now at the edge of a bullish breakout. The support levels of $285, $280, and $270 may come to play if the price remains below the moving averages.
ETH/USD is seen penetrating around the 9-day and 21-day moving averages within the ascending channel. More so, the break above these moving averages is the first signal needed for a bullish to press higher. Nevertheless, ETH/USD has to break above $380 before hitting the potential resistance levels at $415, $420, and 425.
Against BTC, Ethereum is trading below the 9-day and 21-day moving averages within the channel and the price is now hovering at 3277 SAT as the RSI (14) moves in the same direction above the 44-level. Although the bears remain the dominant of the market, the bulls may need to break the above the 9-day and 21-day moving averages to take charge.
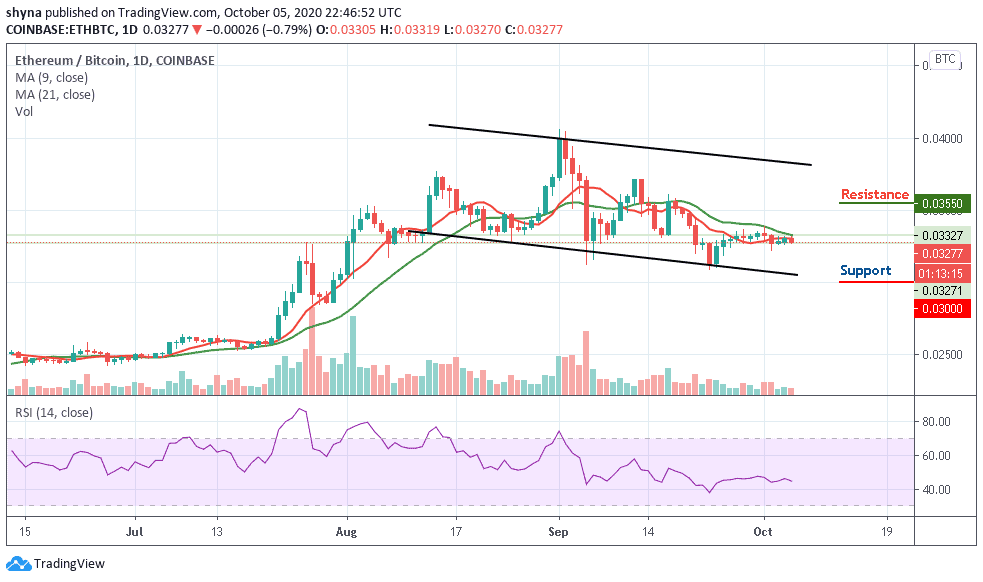
However, the resistance levels to be reached are located at 3550 SAT and above. Conversely, a lower sustainable move below the moving averages could attract the sellers to step back into the market with the next focus on 3000 SAT and below.
Join Our Telegram channel to stay up to date on breaking news coverage