Join Our Telegram channel to stay up to date on breaking news coverage
Bitcoin (BTC) Price Prediction – October 5
The Bitcoin (BTC) is currently trading at $10,740 after slipping below $10,500 at the beginning of this month.
BTC/USD Long-term Trend: Bullish (Daily Chart)
Key levels:
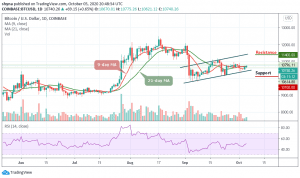
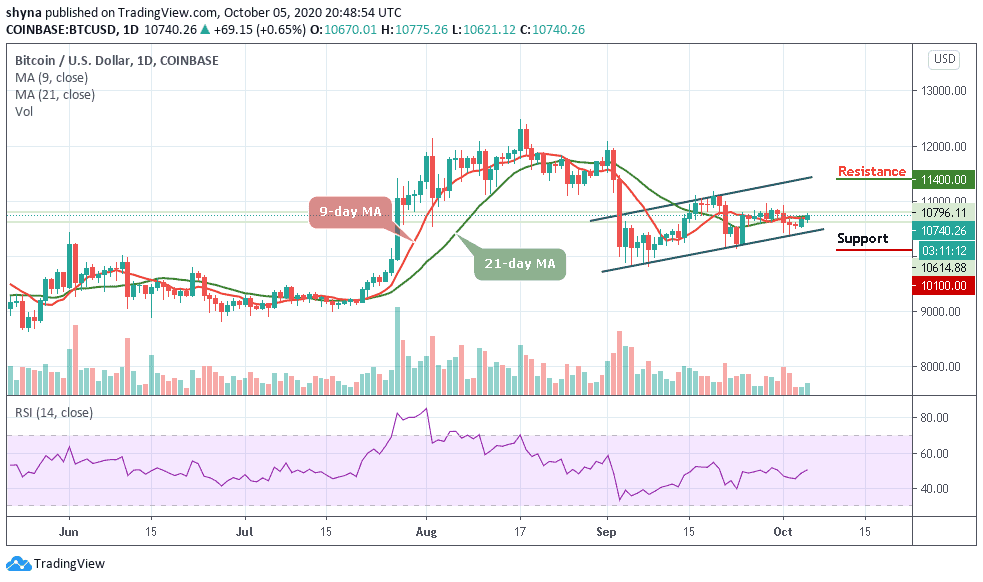
Resistance Levels: $11,400, $11,600, $11,800
Support Levels: $10,100, $9,900, $9,700
BTC/USD and the entire cryptocurrency market are pushing higher today, which may be coming about to do strength in the stock market. This latest move marks an upwards break of the consolidation phase seen as of late, but it is important to note that it has not led BTC past any key technical levels. Bitcoin has been consolidating over the past few days, struggling to gain any momentum as the entire market’s uptrend stalls.
What Is the Next Direction for Bitcoin?
At the time of writing, BTC/USD is trading up marginally at its current price of $10,740. Although this only marks a slight climb from where it has been trading throughout the past several days but it is important to note that this seems to mark a bull-favoring break above the 9-day and 21-day moving averages of the tight trading range seen over the past few days. However, this range existed between $10,300 and $10,800, coming about as a result of the cryptocurrency’s severe lack of directionality.
Meanwhile, as the technical indicator RSI (14) faces the north, a sustainable move above the upper boundary of the channel could locate the potential resistance of $11,400, reaching this may also allow for an extended recovery towards $11,600 and $11,800 respectively. Nevertheless, an increase in selling pressure across the market may force the Bitcoin price to cross below the lower boundary of the channel and move towards the tentative supports at $10,100, $9,900, and $9,700.
BTC/USD Medium-Term Trend: Bullish (4H Chart)
According to the 4-hour chart, BTC/USD should recover above $10,800 above the upper boundary of the channel to mitigate the short-term bearish pressure and allow for an extended recovery towards $10,900. A higher resistance may be found at $11,100 and $11,300 resistance levels.

In contrast, the nearest support is at $10,700, and a sustainable move below this level may increase the downside pressure and push the price towards $10,600 and $10,400 support levels. Considering that the RSI (14) is starting to revert to the upside, we might expect that the bull’s case scenario may play out.
Join Our Telegram channel to stay up to date on breaking news coverage