Join Our Telegram channel to stay up to date on breaking news coverage
XRP Price Prediction – September 18
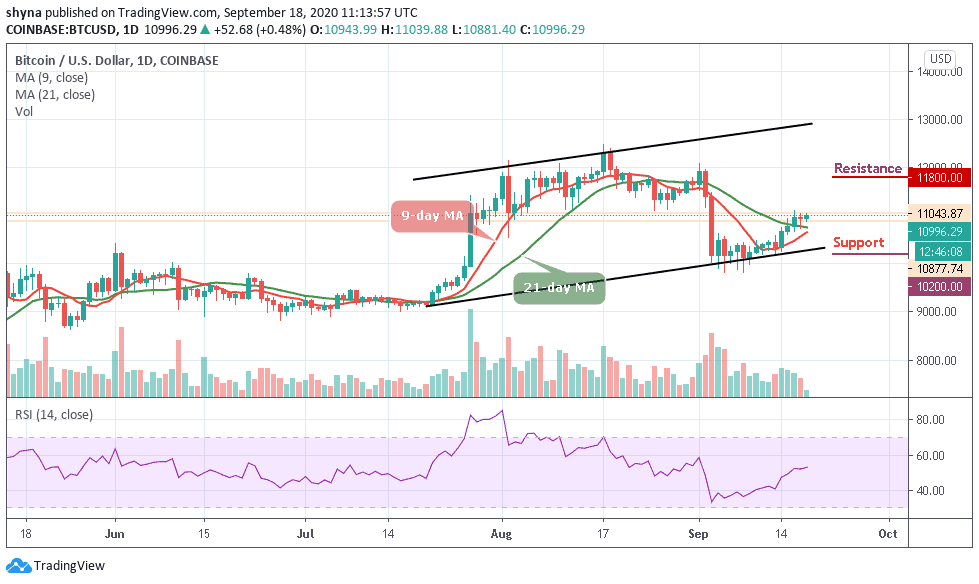
The Ripple (XRP) price continues to trade below the crucial $0.25 resistance level.
XRP/USD Market
Key Levels:
Resistance levels: $0.28, $0.30, $0.31
Support levels: $0.22, $0.21, $0.20

At the time of writing, XRP/USD is correcting downwards after touching the resistance at $0.255. However, given the large narrowing in price action, a breakout could very well be explosive for the coin as the price moves within the 9-day and 21-day moving averages, subject to a breach. The Ripple’s price is changing hands at $0.249 within a range high up at $0.253 down to a low of $0.235.
What Is the Next Direction for Ripple (XRP)?
However, the daily chart reveals that the coin is seen correcting downwards after having soared at $0.255. Unable to hit the resistance, the coin is moving towards the major support at $0.240. But once the coin rightly gains the required momentum, it is ought to bounce back and retest the formed resistance.
At the moment, the RSI (14) is currently facing the south; breaking above the 21-day moving average may likely push the coin towards the $0.28, $0.29, and $0.30 resistance levels. But if the bears continue with the current movement and push the price below the 9-day moving average; it could find its low at the support levels of $0.22, $0.21, and $0.20 respectively.
When compares with Bitcoin, XRP is trading on the downside, although the price action has remained intact within the channel. If the selling pressure persists, the XRP price variation may likely create a new low in the few days. For now, if the RSI (14) crosses below the 40-level; traders may see more negative moves in the market soon.
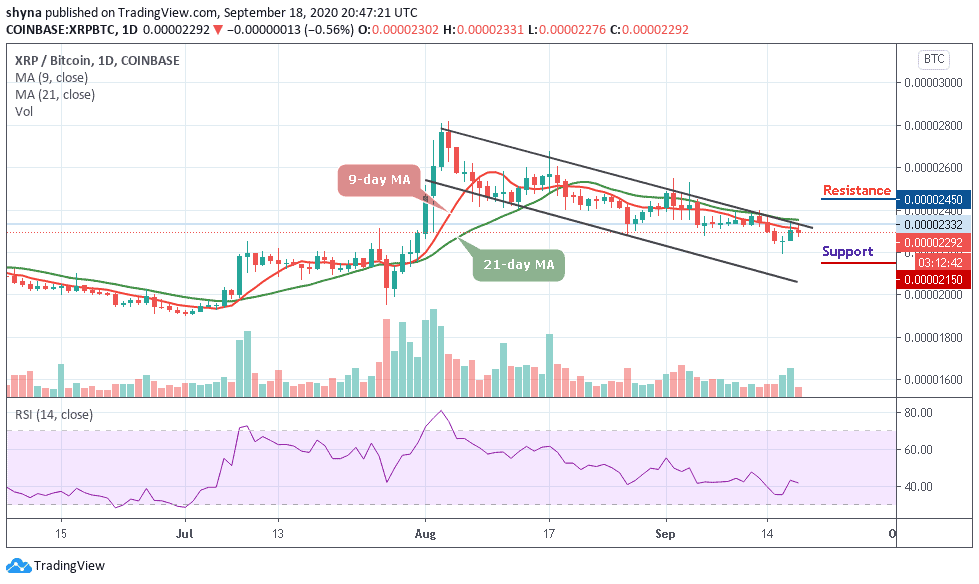
However, the coin remains under the 9-day and 21-day moving averages at 2292 SAT. We can expect close support at the 2250 SAT before breaking to 2150 SAT and below. If a bullish move occurs and validates a break above the moving averages, we can then confirm a bull-run for the market and the nearest resistance levels lie at 2450 SAT and above.
Join Our Telegram channel to stay up to date on breaking news coverage