Join Our Telegram channel to stay up to date on breaking news coverage
Bitcoin (BTC) Price Prediction – September 18
The Bitcoin (BTC) is currently correcting gains, but dips are likely to remain supported near $10,500.
BTC/USD Long-term Trend: Ranging (Daily Chart)
Key levels:
Resistance Levels: $11,800, $12,000, $12,200
Support Levels: $10,200, $10,000, $9,800
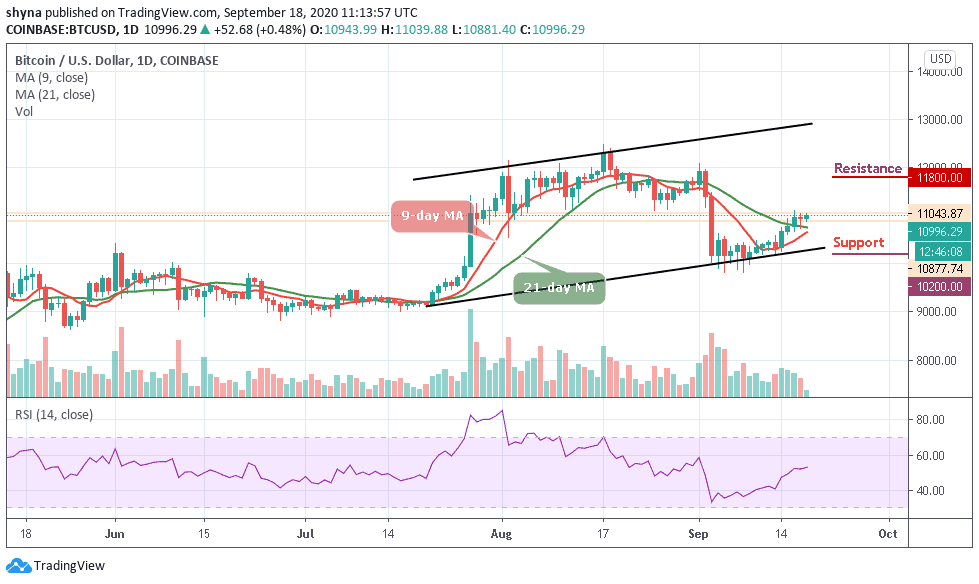
According to the daily chart, BTC/USD may extend the downside correction after a failed attempt to settle above $11,000. Early this morning, the first digital asset breaks above $11k and went as high as $11,039, holding the level for a while before facing a rejection that pushes the coin slightly below range at the time of writing.
What to Expect from Bitcoin (BTC)
BTC/USD holds above the 9-day and 21-day moving averages. However, the market can be expected to continue to sell as declines converge. But if the bulls show a bigger bet, BTC/USD could move towards the resistance levels of $11,800, $12,000, and $12,200.
Nonetheless, the daily chart shows that the weak bullish momentum affected the Bitcoin bulls as the bears could push the price towards $ 10,800 to increase the probability of a bearish scenario which may take the price to $10,200, $10,000, and $9,800 levels in the next period of inactivity. However, the technical indicator RSI (14) remains below the 55-level.
BTC/USD Medium-Term Trend: Ranging (4H Chart)
On the 4-hour chart, Bitcoin’s price is now trading below the 9-day and 21-day moving averages as the bearish supply is coming up slowly in the market, but the bulls are making an attempt to push the price back above the $10,900. Meanwhile, the $10,650 and below may come into play if the coin breaks the lower boundary of the channel.
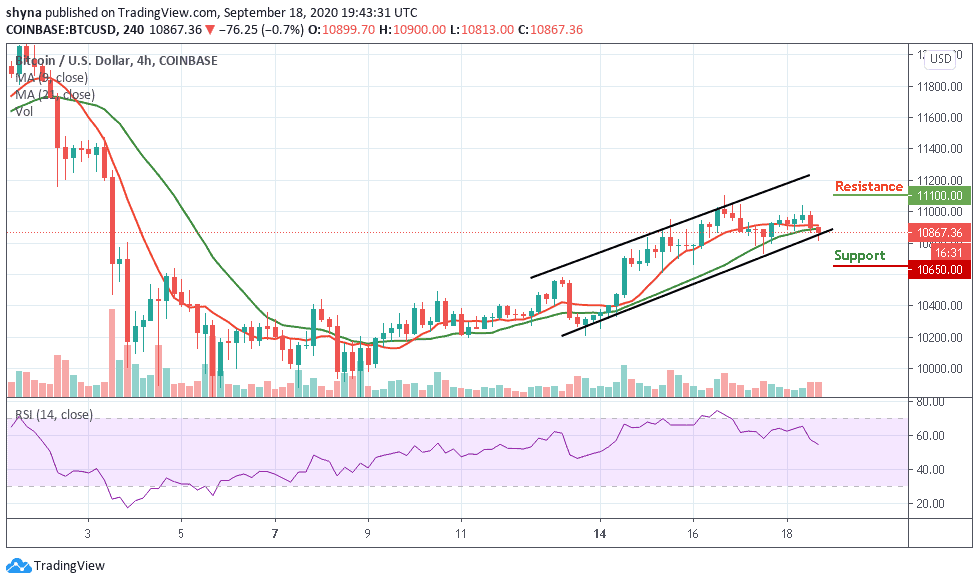
However, once the bulls strengthen and energize the market, traders may expect a retest of the $11,000 resistance level. Therefore, breaking the mentioned level could allow the bulls to reach the potential resistance levels of $11,100 and above. For now, the RSI (14) remains below the 60-level, indicating more drops may come into focus.
Join Our Telegram channel to stay up to date on breaking news coverage