Join Our Telegram channel to stay up to date on breaking news coverage
XRP Price Prediction – August 19
The Ripple (XRP) price continues to fall with a loss of 5.45% as the coin drops back beneath $0.30 to reach $0.284.
XRP/USD Market
Key Levels:
Resistance levels: $0.33, $0.35, $0.37
Support levels: $0.25, $0.23, $0.21
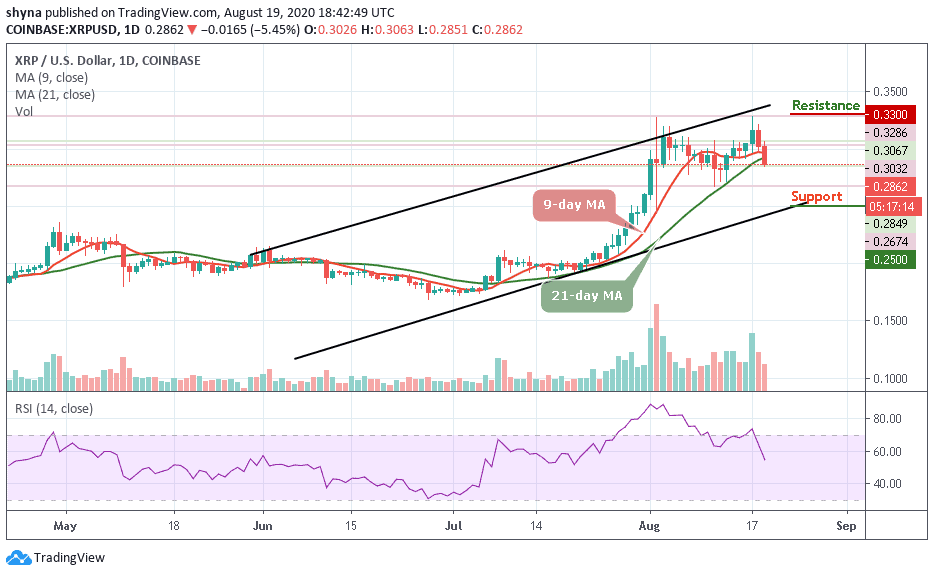
Early this week, XRP/USD managed to push above $0.30 as the coin penetrated a short-term falling price channel. The cryptocurrency reached as high as $0.328 before it started to head lower. Yesterday, XRP/USD fell from $0.321 as it dropped back into the previous short-term declining channel. This decline continued today as the coin penetrated back beneath $0.30 and reached the support at $0.284 below the 9-day and 21-day moving averages.
What is Next for Ripple (XRP)?
XRP/USD is currently rebounding slightly to trade at $0.286. The coin has been bouncing above and below $0.30 since the beginning of this month, and a clean daily candle close above $0.321 could allow the bull-run to continue. A couple of days ago, XRP/USD peaked above the first high and touched $0.328 but got rejected heavily dropping below $0.30 in the next two days.
Nevertheless, if the sellers push the coin lower, the first level of support is located at $0.280. If the bears continue beneath $0.28, further supports are located below the lower boundary of the channel at $0.25, $0.23, and $0.21. On the other side, if the bulls can regroup and push higher, the first level of resistance lies at $0.30. Following this, additional resistance is located at $0.33, $0.35, and $0.37 levels.
Meanwhile, the RSI (14) is moving below 60-level, suggesting that the sellers are ready to take control of the market momentum.
Against Bitcoin, the pair is currently trading below the 9-day and 21-day moving averages, if the sellers push the price beneath the lower boundary of the channel, the first level of support lies at 2400 SAT. Beneath this, other supports lie at 2150 SAT, 2050 SAT, and 1950 SAT.
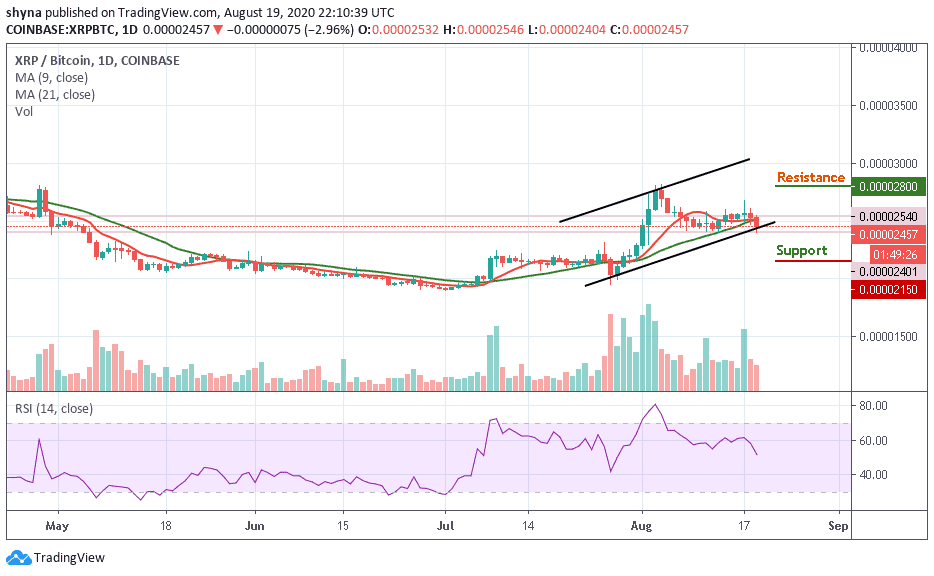
On the other side, the first level of resistance lies at 2600 SAT. Following this, resistance is found at 2800 SAT and 2900 SAT. Likewise, the RSI (14) has dipped beneath the 55-level to indicate that the bears are now in control of the market momentum, a worrying sign for the bulls.
Join Our Telegram channel to stay up to date on breaking news coverage