Join Our Telegram channel to stay up to date on breaking news coverage
XRP Price Analysis – September 21
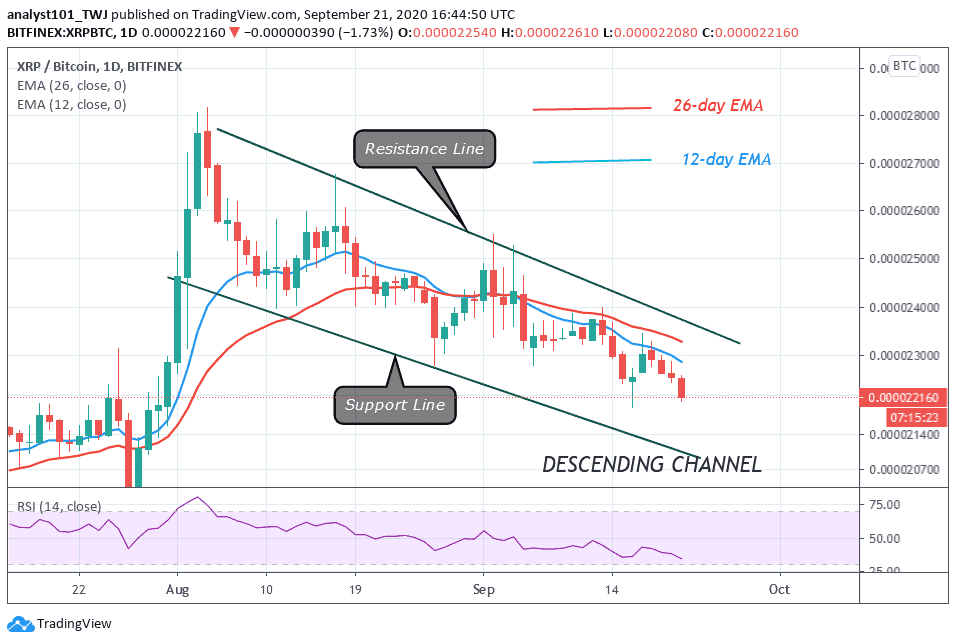
XRP/USD has been on a downward move as price makes lower lows and lower highs. The coin has been falling from a high of $0.32 and may probably reach a low of $0.21. Similarly, the XRP/BTC is also falling from the high of Ƀ0.00002800 and has reached a low of Ƀ0.000022170.
XRP/USD Market
Key Levels:
Resistance Levels: $0.24, $0.26, $0.28
Support Levels: $0.22, $0.20, $0.18

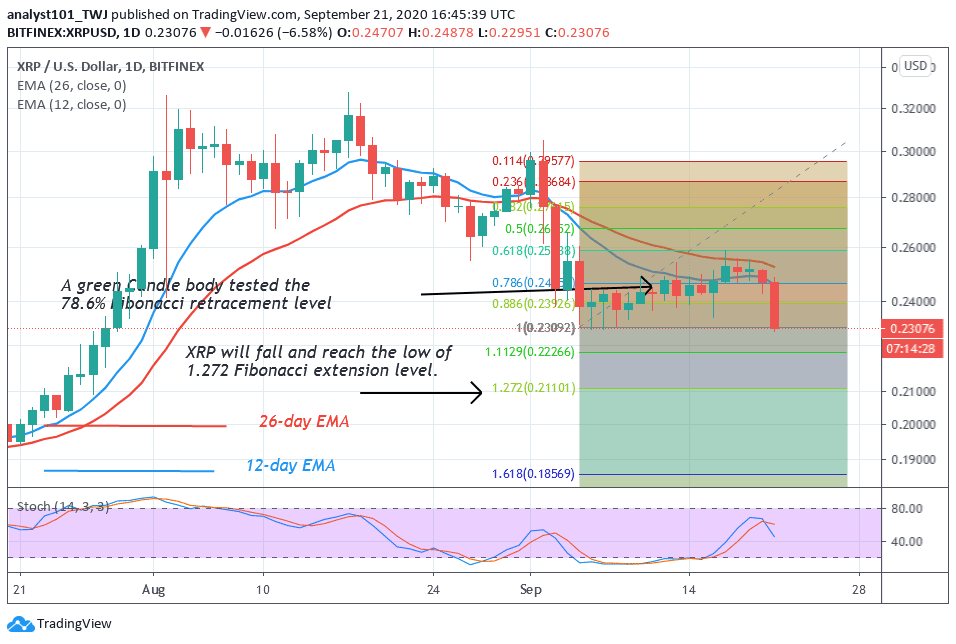
Ripple’s last bearish impulse was on September 5 when it fell to $0.23 low. For the past two weeks, it has been range-bound between $0.23 and $0.26. Earlier on, the crypto was falling on a price pattern of lower lows and lower highs. It has already made a lower low at $0.23 and was making a lower high at $0.26. The bearish price would have been terminated if price has broken above the $0.26 resistance. Rather the coin faced rejection and resumed the downward move.
XRP is on a downward move approaching the lower low or $0.23 support. On the downside, XRP is likely to reach a low of $0.21. According to the Fibonacci tool, XRP will further decline if price breaks the $0.23 support. On September 5 downtrend; XRP fell to the low of $0.23. The retraced candle body tested the 78.6% Fibonacci retracement level. This indicates that Ripple will further decline. It will fall and reach a low of 1.272 Fibonacci extension level. That is a low of $0.21.
Ripple (XRP) Indicator Analysis
The price has broken below the 12-day and 26-day EMA. This indicates that the coin has resumed a downward move. XRP is below 60% range of the daily stochastic. It means the coin is in a bearish momentum. The EMAs are sloping downward indicating the downtrend.

Similarly, on the XRP/BTC chart, the crypto is on a downward move. The coin is trading in a descending channel. The price bars are below the EMAs indicating the downward movement of the coin. Today, XRP/BTC is trading at Ƀ0.000022120 at the time of writing. The market is vulnerable to further downward movement of the coin. The altcoin is at level 34 of the Relative Strength Index period 14. It indicates that the coin is approaching the oversold region of the market. A break below the support line of the descending channel will lead to a further decline of the coin.
Join Our Telegram channel to stay up to date on breaking news coverage


