Join Our Telegram channel to stay up to date on breaking news coverage
XRP Price Analysis – October 17
XRP/USD has fallen to the support above $0.24 after rejection from the $0.26 overhead resistance. The holding of the support at $0.24 will determine the direction of the coin. In the last 24 hours, the bulls and bears have engaged in price tussle above the $0.24 support. The XRP/BTC is also on a downward move but it is reaching a bearish exhaustion.
XRP/USD Market
Key Levels:
Resistance Levels: $0.24, $0.26, $0.28
Support Levels: $0.22, $0.20, $0.18

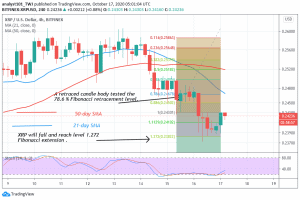
Following the rejection at the $0.26 high Ripple fell to $0.24 support and resumed fluctuation above it. In the last 24 hours, the current support has been holding. A fresh upward move will commence if the $0.24 support holds. The coin will rise and retest the $0.26 overhead resistance. Conversely, if the bears break the current support at $0.24, the downtrend will resume. Nonetheless, from the 4-hour chart, the price action indicates that XRP will further decline. On October 16 downtrend; the retraced candle body tested the 78. 6% Fibonacci retracement level. This implies that the Ripple will fall to the 1.272 Fibonacci extension level. That is a low of $0.238.
Ripple (XRP) Indicator Analysis
Ripple price bars are below the SMAs. This suggests that the coin will make a downward movement to the previous lows. The coin is above the 25% range of the daily stochastic. It indicates that Ripple is in a bullish momentum. This is contrary to the price action which shows signs of bearish signals.
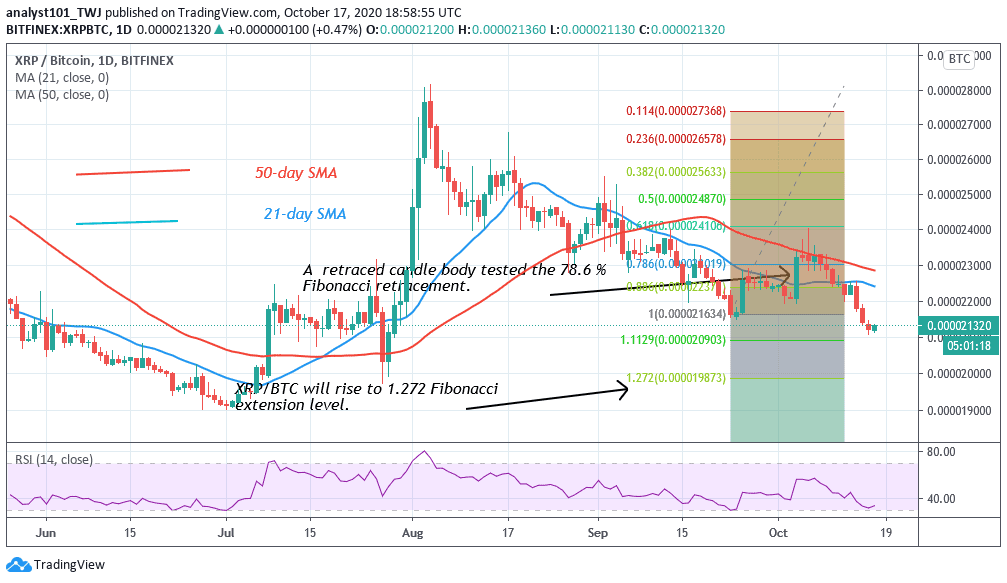
Since August 3, XRP/BTC has been on a downtrend. On September 23 downtrend; a retraced candle body tested the 78.6 %Fibonacci retracement level. This retracement further explains that the coin will fall to level 1.272 Fibonacci extensions. That is XRP/BTC will fall to level Ƀ0.000019873. The coin is at level 31 of the Relative Strength Index period 14. It indicates that the coin is in the downtrend zone and below the centerline 50. The market is also approaching the oversold region of the market.
Join Our Telegram channel to stay up to date on breaking news coverage