Join Our Telegram channel to stay up to date on breaking news coverage
XRP Price Analysis – October 10
XRP/USD has resumed upward move but faces resistance at $0.26 high. Buyers are making frantic efforts to break into the previous highs. A breakout at $0.26 will propel the price to reach $0.30 high. The XRP/BTC is still making lower highs and lower lows as price reached the low of Ƀ0.000022650.
XRP/USD Market
Key Levels:
Resistance Levels: $0.24, $0.26, $0.28
Support Levels: $0.22, $0.20, $0.18
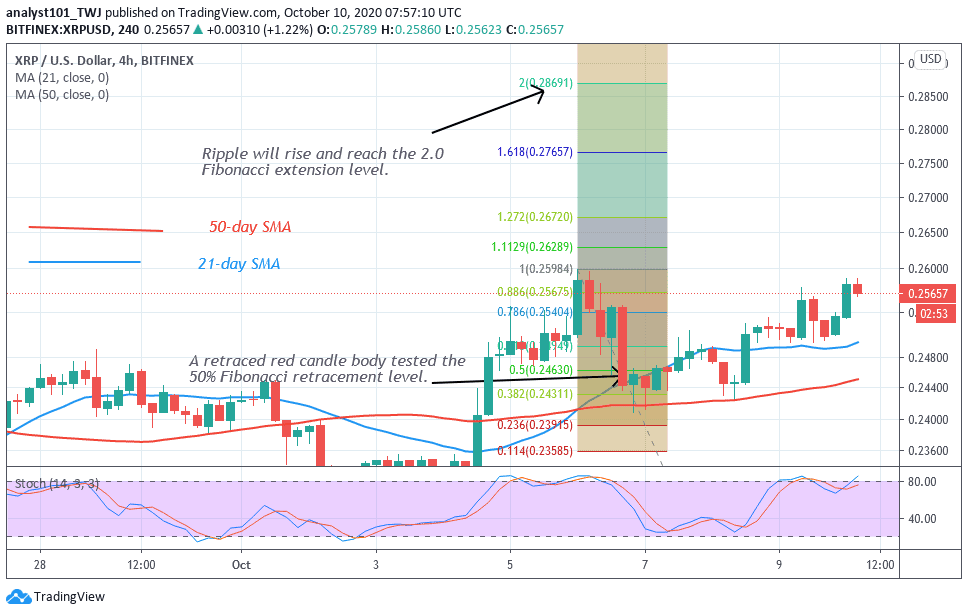
Ripple has been making impressive moves since October 5. It rebounded above $0.23 support and rallied to the $0.2550 high. After a pullback to $0.247 low, the coin rallied again to $0.26 high on October 6. Buyers find penetration difficult at the $0.26 resistance zone. In the meantime, XRP is fluctuating between $0.24 and $0.26 price levels as the coin continues to retest the $0.26 resistance zone. On the upside, if price breaks above the $0.26 high, Ripple will be in the bullish trend zone. There is a possibility of price acceleration on the upside.
Ripple will rise to $0.30 high if the bulls achieve a breakthrough. Conversely, if the bulls are unsuccessful, the coin will compel to a range-bound movement. In other words, XRP may face another decline if the $0.24 support cracks. On October 6 uptrend, Ripple was resisted as price reached a high of $0.26. The retraced red candle body tested the 50% Fibonacci retracement level. This gives the clue that XRP will rise and reach level 2.0 Fibonacci extension. That is, a high of $0.286.
Ripple (XRP) Indicator Analysis
Ripple price has broken above the SMAs and the price momentum has been sustained. This suggests the resumption of an upward move. XRP is above the 80% range of the daily stochastic. This indicates that the coin is in a strong bullish momentum. Besides, Ripple is approaching the overbought region of the market. That is at the overbought region sellers may emerge to push prices down.
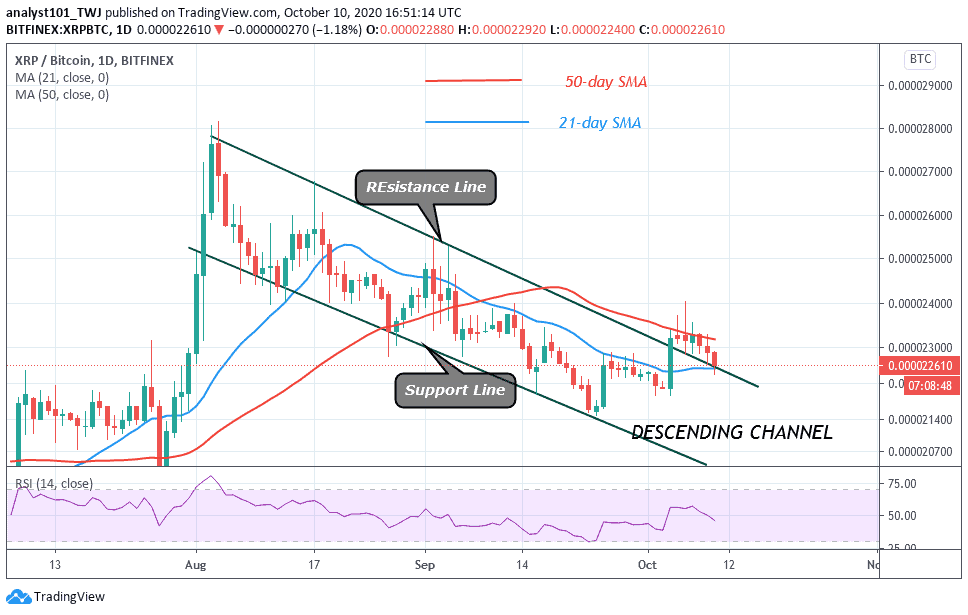
On the XRP/BTC chart, the crypto has been consistent in its downward move. The coin has been making a series of lower highs and lower lows. On October 4, the price broke the resistance line of the descending channel. The breakout was unsuccessful as it faces rejection at the 50-day SMA. The price is retracing back to the descending channel. Today, XRP/BTC is trading at Ƀ0.000022650 at the time of writing. The coin is at level 46 of the Relative Strength Index period 14. It indicates that the coin is in the downtrend zone and below the centerline 50.
Join Our Telegram channel to stay up to date on breaking news coverage