Join Our Telegram channel to stay up to date on breaking news coverage
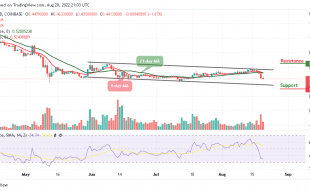
The Ripple price prediction continues to battle with the $0.34 level as the coin remains below the 9-day and 21-day moving averages.
Ripple Prediction Statistics Data:
- Ripple price now – $0.33
- Ripple market cap – $16.6 billion
- Ripple circulating supply – 49.3 billion
- Ripple total supply – 99.98 billion
- Ripple Coinmarketcap ranking – #7
XRP/USD Market
Key Levels:
Resistance levels: $0.42, $0.44, $0.46
Support levels: $0.25, $0.23, $0.21
Your capital is at risk
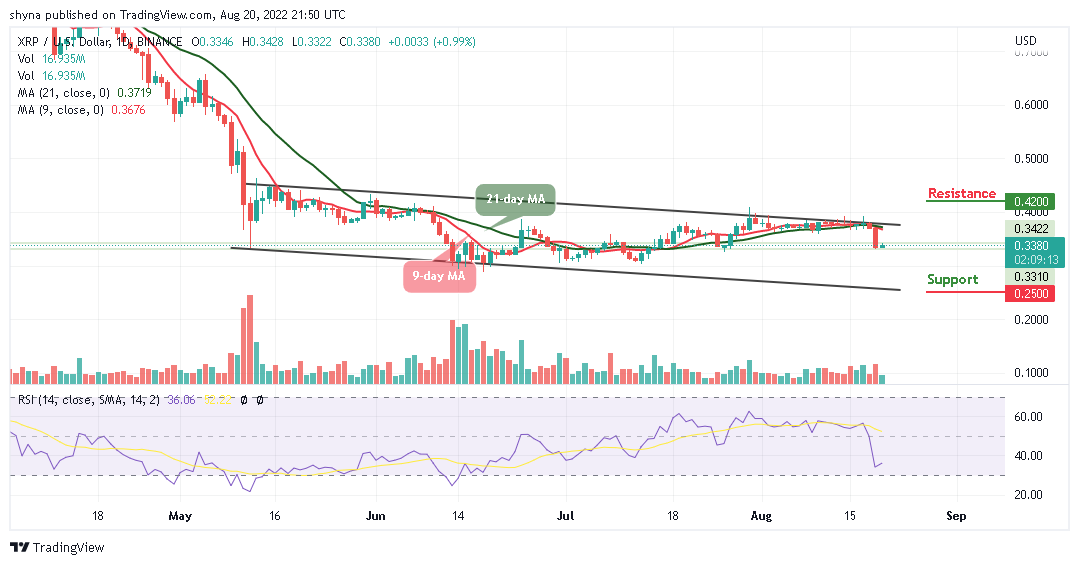
At the time of writing, XRP/USD is seen trading at $0.33 below the 9-day and 21-day moving averages. The cryptocurrency remains at the downside as it continues to struggle toward the upside. More so, the attempt to begin the upward movement shows that the bulls are battling to be in control of the market momentum.
Would Ripple Go Up Like Tamadoge (TAMA)?
Looking at the chart, the Ripple price is likely to head towards the moving averages while the nearest resistance level lies at $0.40. If the bulls can break above this level, higher resistance is located at $0.42, $0.44, and $0.46. Meanwhile, if the price decides to face the lower boundary of the channel, the nearest support to reach may be at the $0.30 level. Beneath this, further supports could be located at $0.25, $0.23, and $0.21.
However, the technical indicator Relative Strength Index (14) remains below the 40-level as traders wait for a bullish spike to push the market higher. More so, the coin may move bullishly if the bulls put in more effort.
Against Bitcoin, XRP has been ranging around the 9-day and 21-day moving averages trading at 1597 SAT. The nearest resistance lies above the 9-day and 21-day moving averages but if the buyers push the Ripple (XRP) above 1600 SAT, the higher resistance level will be located at 1800 SAT and above.
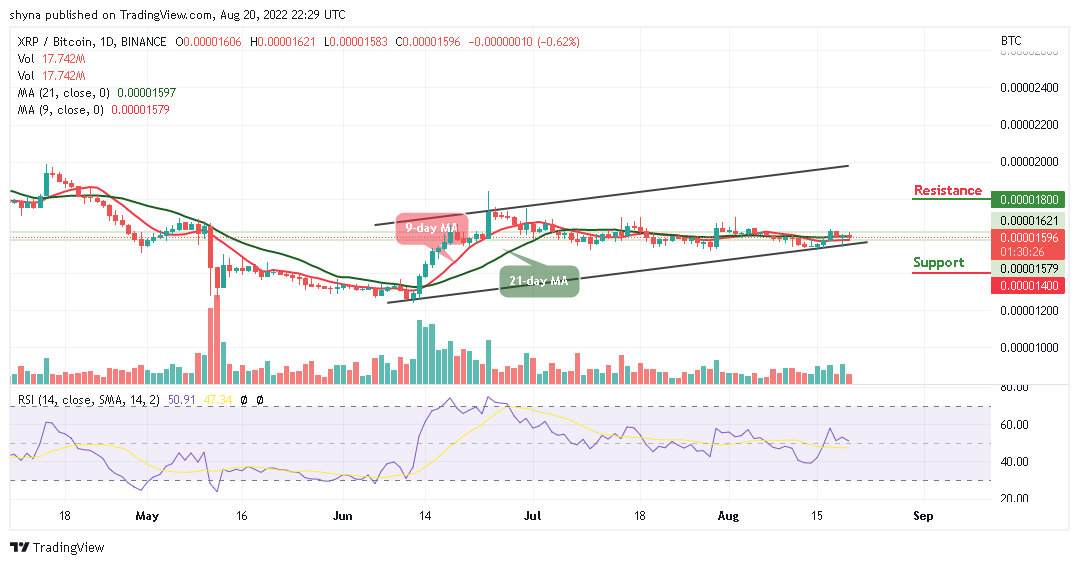
Moreover, the market price may cross below the lower boundary of the channel to increase the bearish signals. However, if the downtrend movement continues to play out, this can lead to the support level of 1400 SAT and below. Meanwhile, the market may move into the negative side as the technical indicator Relative Strength Index (14) may cross below 50-level.
Related:
Join Our Telegram channel to stay up to date on breaking news coverage