Join Our Telegram channel to stay up to date on breaking news coverage
XPTUSD Price Analysis – June 23
XPT price direction may turn upside should the Bulls increases their pressure and this may place the price above $833 level. In case the $833 demand level holds consolidation may continue.
XPT/USD Market
Key levels:
Supply levels: $833, $898, $962
Demand levels: $776, $714, $657
XPTUSD Long-term trend: Bearish
XPTUSD is on the bearish movement on the weekly chart. The weak Bearish momentum is noticed on the weekly chart, likewise, the Bulls’ pressure is not strong; this is what led to insignificant movement in the Platinum market. Last week, the Bulls initially dominated the market but their pressure could not sustain them, then the Bears push the price down to the previous level.
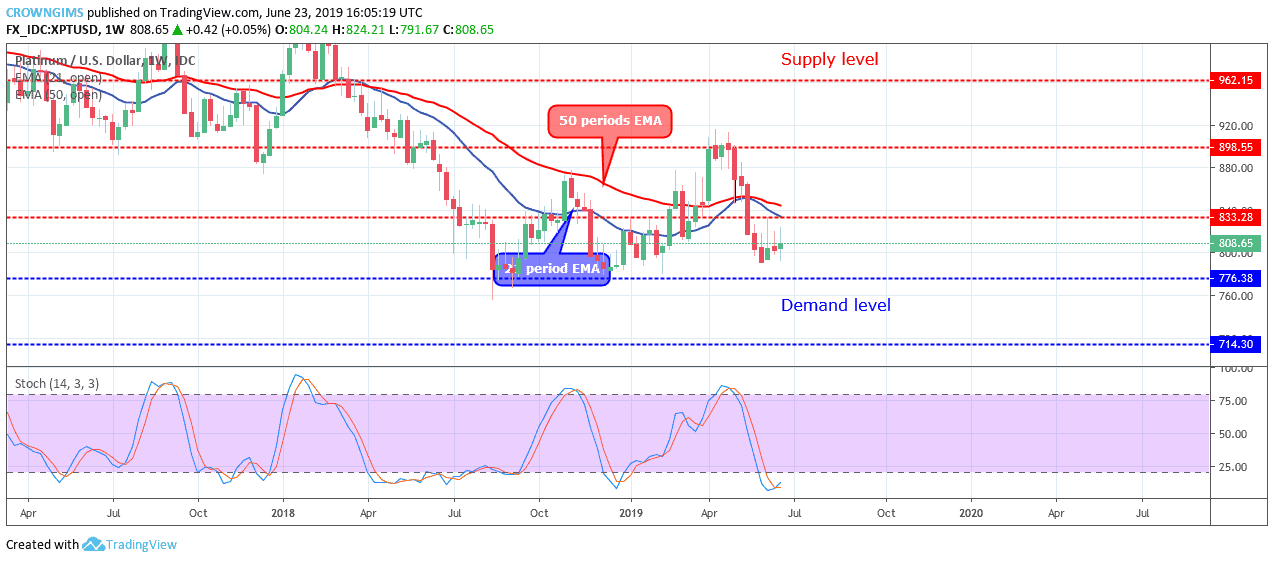
The 21 periods EMA and 50 periods EMA maintain their position above the price as a sign of bearish momentum. Nevertheless, the stochastic Oscillator period 14 is below 25 levels (oversold level) with the signal line pointing up to indicate a buy signal. XPT price direction may turn upside should the Bulls increases their pressure and this may place the price above $833 level. In case the $833 demand level holds, consolidation may continue.
XPTUSD medium-term Trend: Ranging
XPTUSD is ranging in the medium-term outlook. The Bearish momentum that broke down the $833 level on May 17 pushed the price towards the demand level of $776. The Bears was unable to push the price to reach the mark before the Bulls interrupted the bearish movement on June 03.
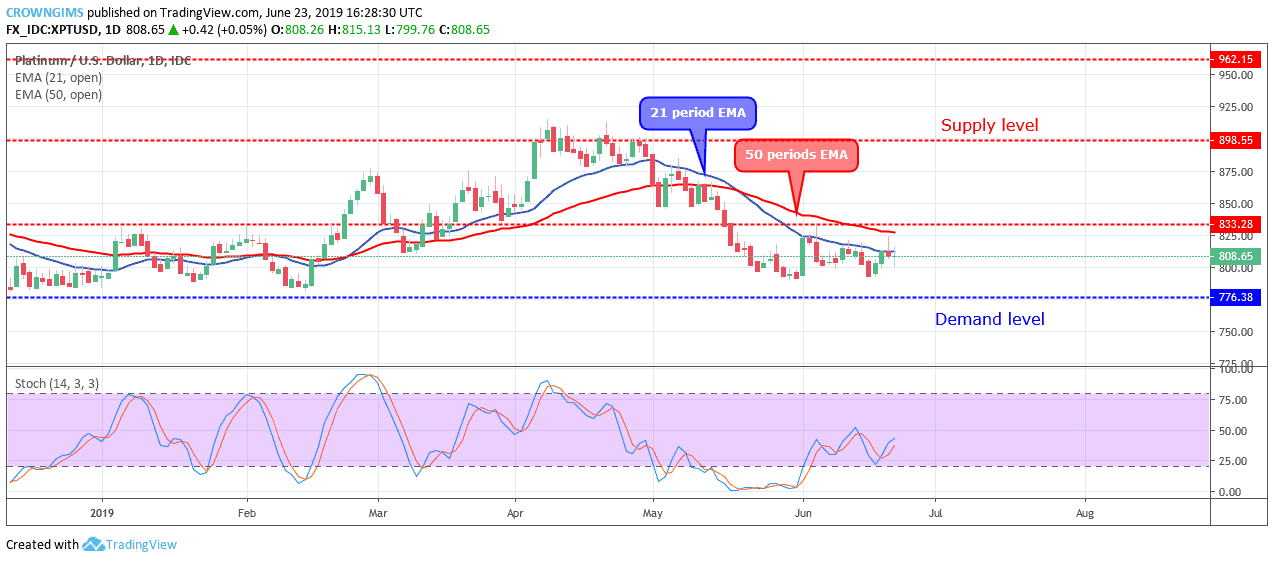
The price moved towards the dynamic support and resistance level 21 periods EMA. The inability of the Bulls to break up the dynamic resistance level and the Bears unable to push the price down caused the ongoing consolidation on the daily chart. However, stochastic Oscillator period 14 is above 40 levels with the signal lines pointing upside to indicate a buy signal.
Please note: insidebitcoins.com is not a financial advisor. Do your own research before investing your funds in any financial asset or presented product or event. We are not responsible for your investing results.
Join Our Telegram channel to stay up to date on breaking news coverage