Join Our Telegram channel to stay up to date on breaking news coverage
XMR Price Analysis – June 22
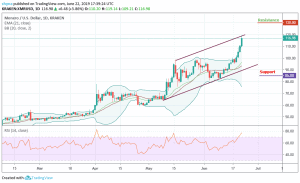
For the first time since November 2018, the XMR/USD broke the $100 mark. During this week, the coin has gone from $96.65 to more than $115 trading at the moment, which has boosted the market momentum and the upward movement.
XMR/USD Market
Key Levels:
Resistance levels: $130, $140, $150
Support levels: $85 $75, $65
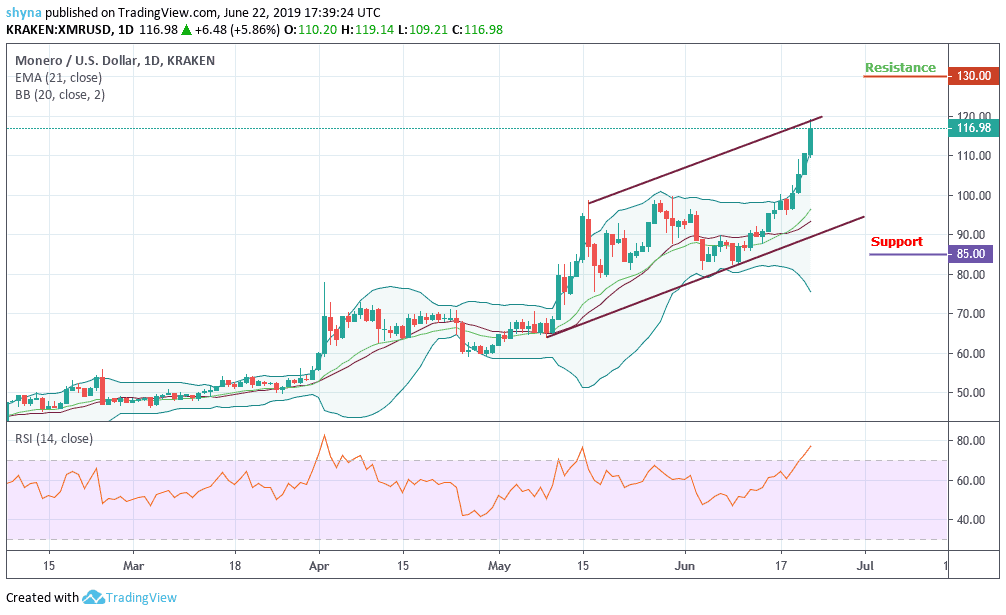
Monero (XMR), the 13th largest cryptocurrency with a current market capitalization of $1.9 billion and an average trading volume of $146 million, is the digital asset with the best performance among the top 20. The coin has gained more than 7% since Thursday till this time and has increased more than 20% in the last seven days. At the time of writing, the XMR/USD is changing hands to $116.47 from $119.06 high recently.
The market price is moving up in the 20-day Bollinger band, which is an extremely bullish session, and Bollinger’s jaw has also expanded, indicating growing market volatility. Bulls tend to push the price to the resistance levels at $130, $140 and $150, trading well above the 21-day EMA and the RSI is already in the overbought zone. Support levels to watch out for are $100, $90 and $80 respectively.
XMR/BTC Market
During the last three months, the XMR/BTC has been moving sideways and, as it seems now, can continue to operate within the limits of the descending channel. Since prices began to fall, there is no attempt to break the significant prices of the channel. This shows a strong support force during the last trading days, as confirmed by the RSI.
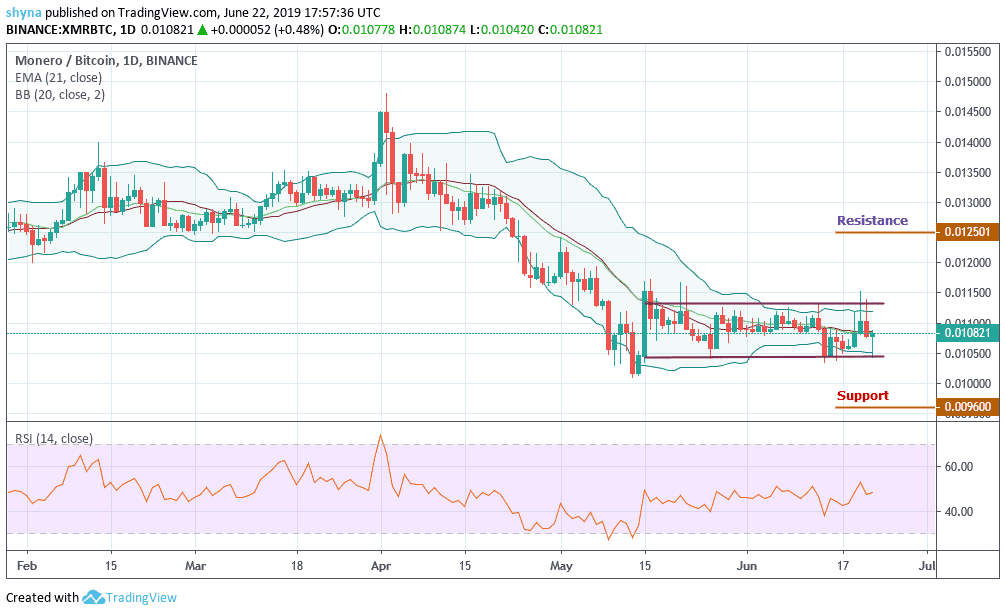
As revealed in the chart, the bears seem to point to the price in the lowest channel, where 0.0105 BTC is based on the continuation of the takeover of the market. Monero seemed to swing laterally since May 29. This suggests a possible change in trend that could occur at any time from now. A bullish play could boost the price above the channel. The level of potential resistance is 0.0125 BTC.
Please note: insidebitcoins.com is not a financial advisor. Do your own research before investing your funds in any financial asset or presented product or event. We are not responsible for your investing results.
Join Our Telegram channel to stay up to date on breaking news coverage