Join Our Telegram channel to stay up to date on breaking news coverage
XPTUSD Price Analysis – June 08
Platinum price may decrease further and reached the $776 demand level in case the Bears’ momentum does not weak. In case the Bears’ momentum becomes weak, the price may start consolidation within the range of $833 and $776 level.
XPT/USD Market
Key levels:
Supply levels: $833, $898, $962
Demand levels: $776, $714, $657
XPTUSD Long-term trend: Bearish
On the weekly chart, XPTUSD is bearish. The Bears would not let the Bulls have their way, the bearish trend continues on the weekly chart. The scenario of last two weeks repeated itself last week in which the Bulls was predominating the market at the early days of the week and the price was increasing, about to break up the supply level of $833. The Bears suddenly wave into the market and exert the pressure which declined the price towards demand level of $776.
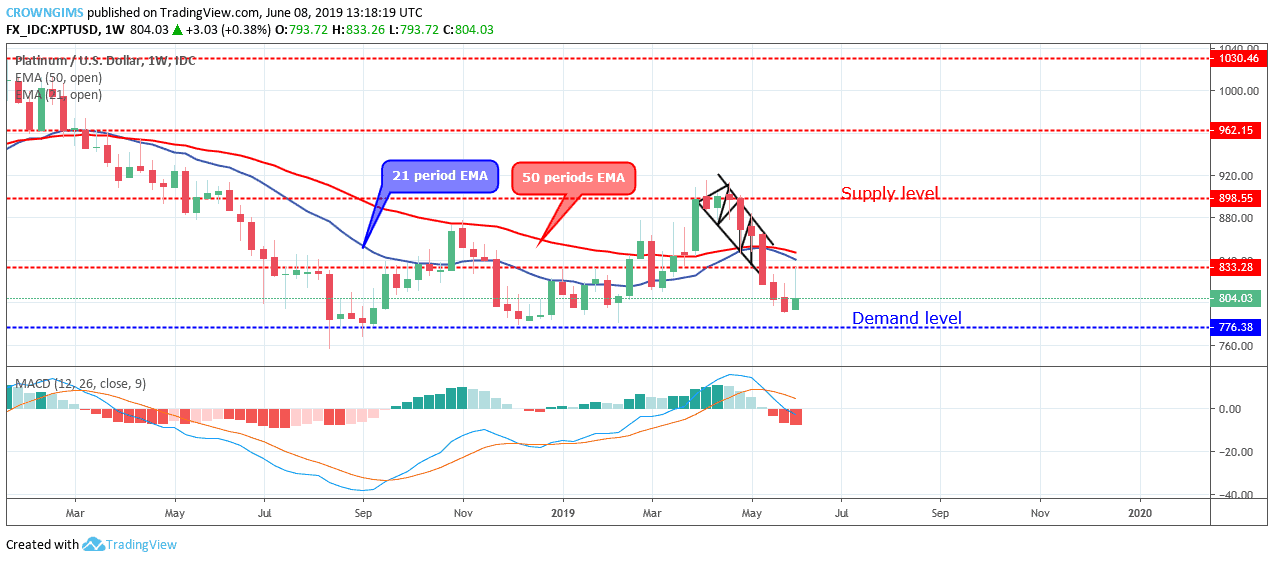
Platinum price continues its trading below the 21 periods EMA and 50 periods EMA, and the Moving Average Convergence divergence period 12 is below zero levels with the signal line pointing down to indicate sell signal. Platinum price is targeting the demand level of $776 in which it may be reached should the Bears maintain their momentum. In case the demand level of $776 holds, the price may bounce and reverse towards $833 level.
XPTUSD medium-term Trend: Bearish
XPTUSD is on the bearish trend in the medium-term outlook. Platinum price is still under the bearish pressure. The bearish momentum extended towards the demand level of $776 but could not reach the mark before the Bulls interrupted on June 03 with the formation of strong and massive bullish candle that pulled back the price towards the broken level of $833.
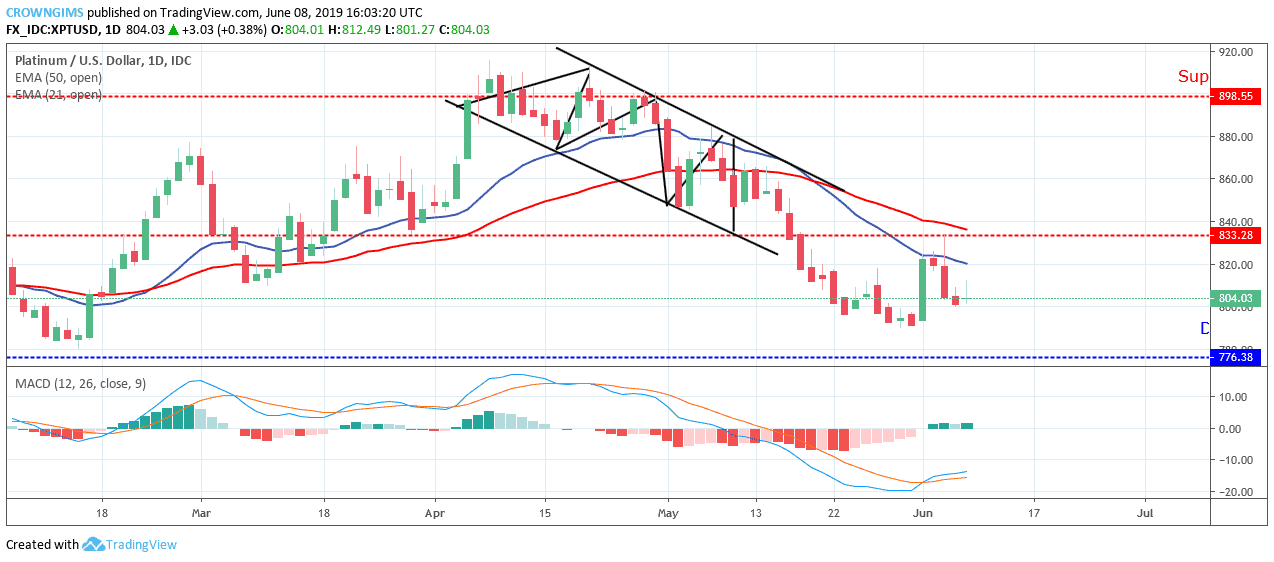
After the retest, the bearish movement continues. Last week market closed with a bearish candle; which implies that the bearish trend may continue in the XPT market.
Please note: insidebitcoins.com is not a financial advisor. Do your own research before investing your funds in any financial asset or presented product or event. We are not responsible for your investing results.
Join Our Telegram channel to stay up to date on breaking news coverage