
Join Our Telegram channel to stay up to date on breaking news coverage
In the fast-paced and unpredictable universe of crypto, one often encounters a deluge of forecasts and predictions. These predictions, whether optimistic or grim, often span a wide spectrum and are made with varying degrees of certainty. But Steve, a known YouTuber from CryptoCrewUniversity, takes a different approach. By meticulously dissecting Bitcoin’s past and present behavior, he offers intriguing insights into what might lie ahead.
Through an in-depth examination of Bitcoin’s two-month and two-week charts, Steve seeks to draw out patterns that are easily overlooked by casual observers. He believes that understanding the historical context of Bitcoin’s behavior is invaluable. It’s like reading the diary of an entity, each entry revealing a bit more about its nature. One of the pivotal moments Steve zeroes in on is from March 2020. At this juncture, Bitcoin showcased a significant pattern known as the ‘dragonfly doji’ on its two-month chart. For the uninitiated, this signaled a trend reversal that was on the horizon.
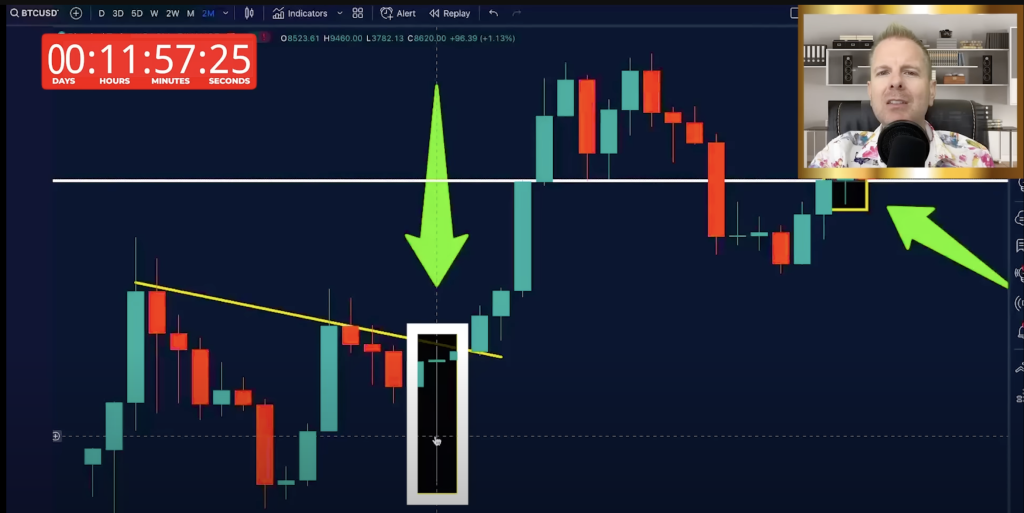
But of all the intricate details Steve unearths, the undeniable emphasis he places is on the importance of the $29,000 level. This isn’t just an arbitrary number. Time and again, this price point has manifested its significance, acting as both a robust support when prices fall and a formidable resistance when they rise. It’s like Bitcoin’s own gravitational center, pulling it back whenever it strays too far.
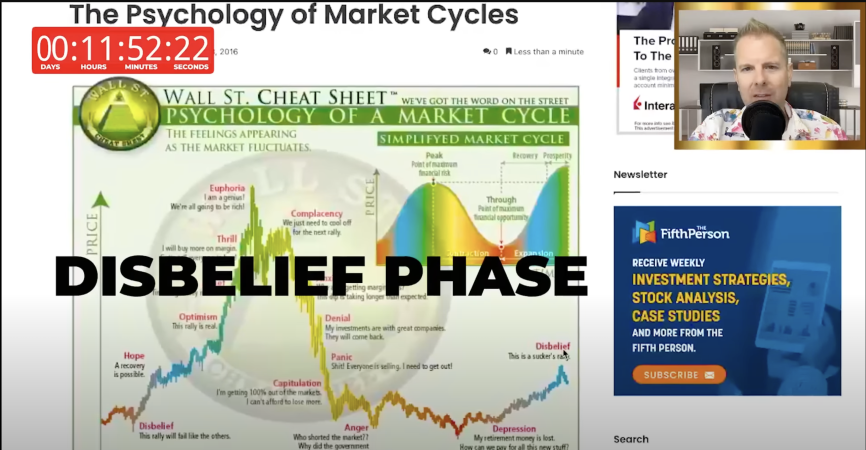
The mainstream discourse surrounding Bitcoin is dominated by two major narratives: the bullish believers who envision Bitcoin soaring to unprecedented heights and the bearish pundits who predict its downfall. Steve’s assessment, however, throws a spanner in these works. He suggests a potential scenario where Bitcoin might eschew both extremes, settling instead into a phase of sideways movement for a considerable period. This insight directly challenges both camps and their firmly held beliefs.
Steve’s analytical approach doesn’t just stop with trend patterns. He also dives into tools like the pi cycle indicator to glean more from the data. According to his evaluation, if Bitcoin breaches the critical red line of this indicator, a descent to the green level is plausible, which could peg Bitcoin at an approximate price of $18,000. On the flip side, maintaining above the red line would mean that these lows remain a distant possibility.
Piecing together his many observations, Steve postulates a potential scenario for Bitcoin’s trajectory in the upcoming months. He believes Bitcoin’s movement could oscillate between $30,000 and $48,000, unlikely to exceed this upper cap.
Steve’s central message is clear: while individual opinions and predictions are aplenty, and often conflicting, charts and data offer an objective, unbiased lens. They distill the noise and provide a clearer perspective on potential trajectories.
When is it Time to Get Into Bitcoin Again?
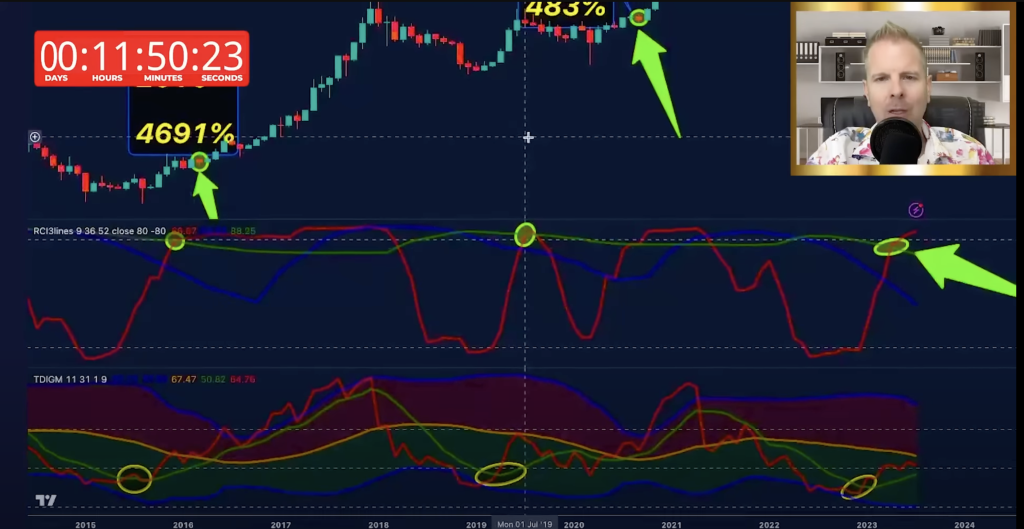
So when is it time to get back into Bitcoin? Steve uses a powerful indicator called Traders Dynamic Index, which he says correctly predicted the beginning of every bull market cycle. More specifically, when the red line crosses above the orange line, that is when it will be time to go in, and go in big. Currently, the red line is still underneath the orange line, but it’s moving ever closer to it.
Related News
- As Halving Looms, Bitcoin Miners Are Weighing Up Their Options
- Most Secure Bitcoin Wallets
- Bitcoin Pre-Halving Year Returns: A Historical Insight
- 15 Best DeFi Coins to Buy in 2023 – Decentralized Finance Tokens
Best Wallet - Diversify Your Crypto Portfolio

- Easy to Use, Feature-Driven Crypto Wallet
- Get Early Access to Upcoming Token ICOs
- Multi-Chain, Multi-Wallet, Non-Custodial
- Now On App Store, Google Play
- Stake To Earn Native Token $BEST
- 250,000+ Monthly Active Users
Join Our Telegram channel to stay up to date on breaking news coverage