
Join Our Telegram channel to stay up to date on breaking news coverage
Bitcoin, the vanguard of the crypto movement, has a history that often seems to be overlooked by investors and analysts who are so focused on the present. In a recent analysis on the returns of Bitcoin during its pre-halving years, interesting patterns have emerged. The larger question we can ask: “Is this time different or is it just another iteration of the same story?” YouTuber Benjamin Cowen, a known crypto analyst, did a recent comprehensive review of Bitcoin’s pre-halving patterns.
A Glance at Historical Returns
By looking at the year-to-date ROI, one thing becomes clear: history does indeed tend to repeat itself. This was evident in the comparative examination of the years 2014, 2018, and 2022. Despite the ever-present belief during these years that “this time it’s different”, in reality, they all displayed remarkably similar patterns.
This became especially evident in the summer of 2022. During that time, there was a widespread belief that Bitcoin had found its bottom at around $17,500. This perspective, as it turned out, was the same misjudgment made by many, in 2018.
The Pre-Halving Pattern
By looking at the pre-halving years in more detail, a recurrent pre-halving pattern emerges. Typically, there is a rally for the first half of the pre-halving year followed by a fade during the latter half. However, although this has been the trend in previous cycles, the market’s unpredictable nature means no outcome can be predicted with certainty.
For instance, the collapse of FTX, a major cryptocurrency exchange, played a significant role in influencing the market’s direction in 2022. Events like these remind us that while historical patterns provide useful insights, they cannot account for all potential market disruptors.
Comparing Pre-Halving Years
Using the data from previous pre-halving years, it’s fascinating to observe the trends that have persisted:
- In 2011, the peak occurred around day 161.
- 2015 saw its peak around day 193 in July.
- While in 2019, the rollover occurred closer to day 177, in June, with a subsequent double top in July on day 179.
In the current cycle, as of the analysis, the peak was on day 194, leaving investors and analysts in suspense about whether this will remain the high.
Is This Time Different?
To help paint a clearer picture of what might come in 2023, Cowen took the average of the 2015 and 2019 returns. Just as combining the 2014 and 2018 data provided insights into 2022’s potential trajectory, this average could serve as a rough blueprint for 2023.
Despite this, calls proclaiming that “this time is different” are not in short supply. There are plenty of voices in the crypto community arguing against the possibility of Bitcoin fading in the latter half of the pre-halving year. As the market is an amalgamation of different opinions and forces, no one can truly say for certain which way it will sway.
While the market’s nature is inherently unpredictable, understanding historical patterns can provide invaluable insights. It is essential, however, to balance this understanding with an openness to the unexpected and a recognition that in the world of cryptocurrencies, there are no certainties.
The Current Times
Interestingly, as we approach August 2023, the financial world is eagerly waiting to hear from the SEC about the Bitcoin spot ETF. The outcome, whatever it might be, could stir renewed interest in the cryptocurrency.
However, historically, as we proceed towards the end of the pre-halving year – the September to December window – Bitcoin’s buzz tends to fade. A retrospective glance suggests that if Bitcoin were to take a dip from its current standing, it could potentially fall to a price range between $23,000 and $16,000. The latter would likely result from heightened recessionary fears and not just minor market jitters.
The price trends of 2019 serve as a cautionary tale. Although the year concluded on a relatively positive note, it witnessed several dramatic downturns, some as steep as 30-35%, from the yearly opening. Drawing parallels between 2016 and 2020, it becomes evident that while the start of a year might promise positivity, the market is susceptible to a secondary scare before ultimately trending upwards.
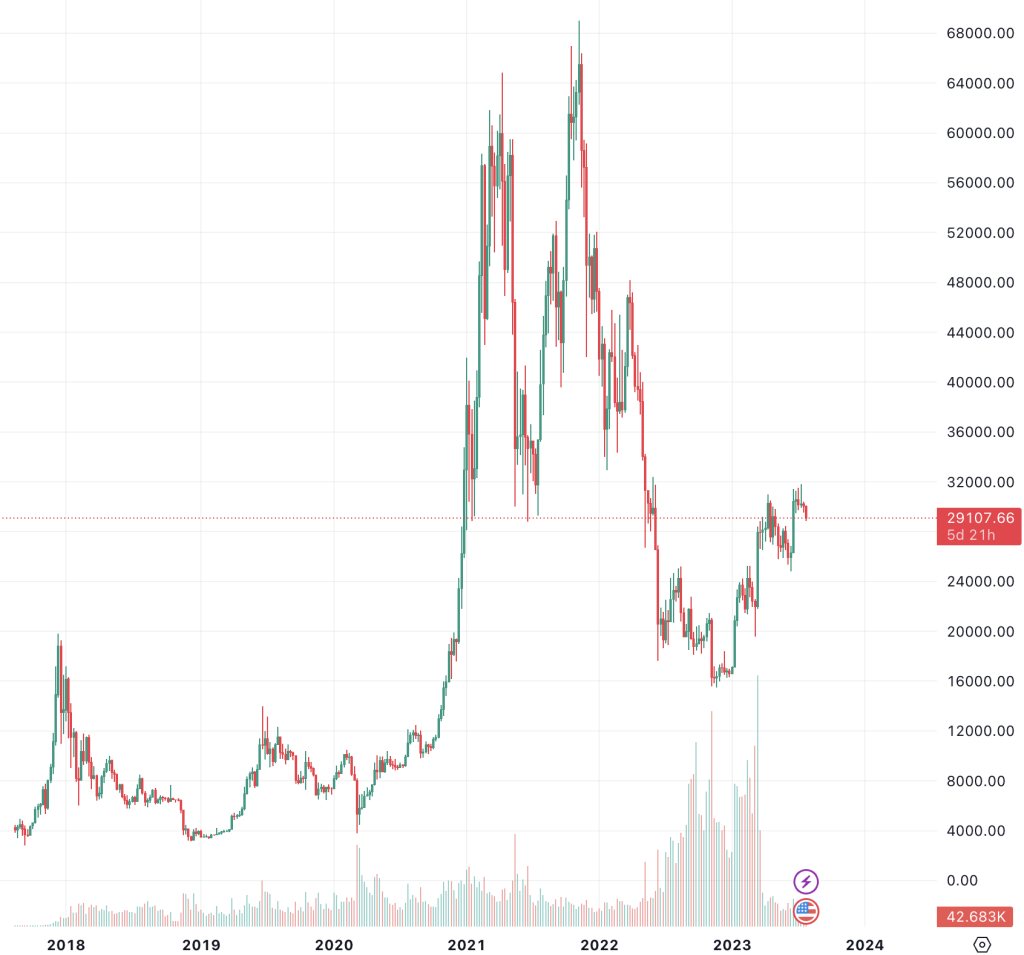
Skeptics might argue that Bitcoin’s trajectory is shifting, suggesting that “this time it’s different”. Yet, a closer analysis debunks that narrative. Indeed, while Bitcoin’s current path reflects a moderated version of 2019’s wild swings, it mirrors closely the performance of 2015.
Establishing expectations for Bitcoin’s annual range, predictions suggested a low of $12,000 and a peak of $35,000. Neither of these extremes has been hit yet, reinforcing the notion that the cryptocurrency is still adhering to its historic pre-halving blueprint.
The Altcoins Outlook
Ethereum’s performance offers a parallel perspective. Comparing Ethereum’s price dynamics in 2019 to its current standing in 2023, we find a similar return on investment (ROI). Similarly, Cardano and Litecoin have displayed patterns this year that aren’t deviating dramatically from their past behaviors.
However, this consistency isn’t solely restricted to individual cryptocurrencies. The total market cap in 2023, for instance, hasn’t surpassed its April high. Yet, comparing this cap to 2015 and 2019 reveals that it is on track with the combined average of both years.
Despite these consistent patterns, the market is rife with voices heralding a deviation from the norm. Such optimistic predictions were also made in the summer of 2022. The general expectation was for an “Alt Season”, a phase where altcoins would surge in value. This optimism proved to be misplaced, as Bitcoin’s price failed to stabilize.
From an investor’s perspective, assuming that “this time it’s different” without concrete evidence can be a risky proposition. There’s always a chorus suggesting deviations from established patterns, but more often than not, history tends to repeat itself.
Consequently, as we navigate the latter half of the pre-halving year, investors should be cautious. The general decline in interest during this phase can be attributed to the halving event still being a considerable distance away.
Only as we draw closer, roughly three to six months out, does the hype begin to escalate.
In conclusion, while the cryptocurrency market is ever-evolving and dynamic, the patterns observed in pre-halving years suggest a consistent trend. Until the data presents a substantial deviation from these established patterns, it might be prudent to adopt a “wait and watch” approach. Only time will reveal whether the “this time it’s different” narrative holds water or is just another passing phase in Bitcoin’s storied journey.
Related News
- As Halving Looms, Bitcoin Miners Are Weighing Up Their Options
- Most Secure Bitcoin Wallets
- US SEC’s Spot Bitcoin ETF Approval Would Have a Global Impact, Market Awaits Regulator’s Decision
- 15 Best DeFi Coins to Buy in 2023 – Decentralized Finance Tokens
Best Wallet - Diversify Your Crypto Portfolio

- Easy to Use, Feature-Driven Crypto Wallet
- Get Early Access to Upcoming Token ICOs
- Multi-Chain, Multi-Wallet, Non-Custodial
- Now On App Store, Google Play
- Stake To Earn Native Token $BEST
- 250,000+ Monthly Active Users
Join Our Telegram channel to stay up to date on breaking news coverage