Join Our Telegram channel to stay up to date on breaking news coverage
Bulls are dominating VeChain market
VeChain Price Analysis – October 04
VeChain is breaking up $0.023 level, it may increase to $0.025, $0.027 and $0.029 resistance levels. The closing of the daily bearish candle below $0.023 level may drop the price at $0.022 and $0.021 levels
VET Price Analysis – October 04
Key Levels:
Resistance levels: $0.025, $0.027, $0.029
Support levels: $0.023, $0.022, $0.021
VET/USD Long-term Trend: Ranging
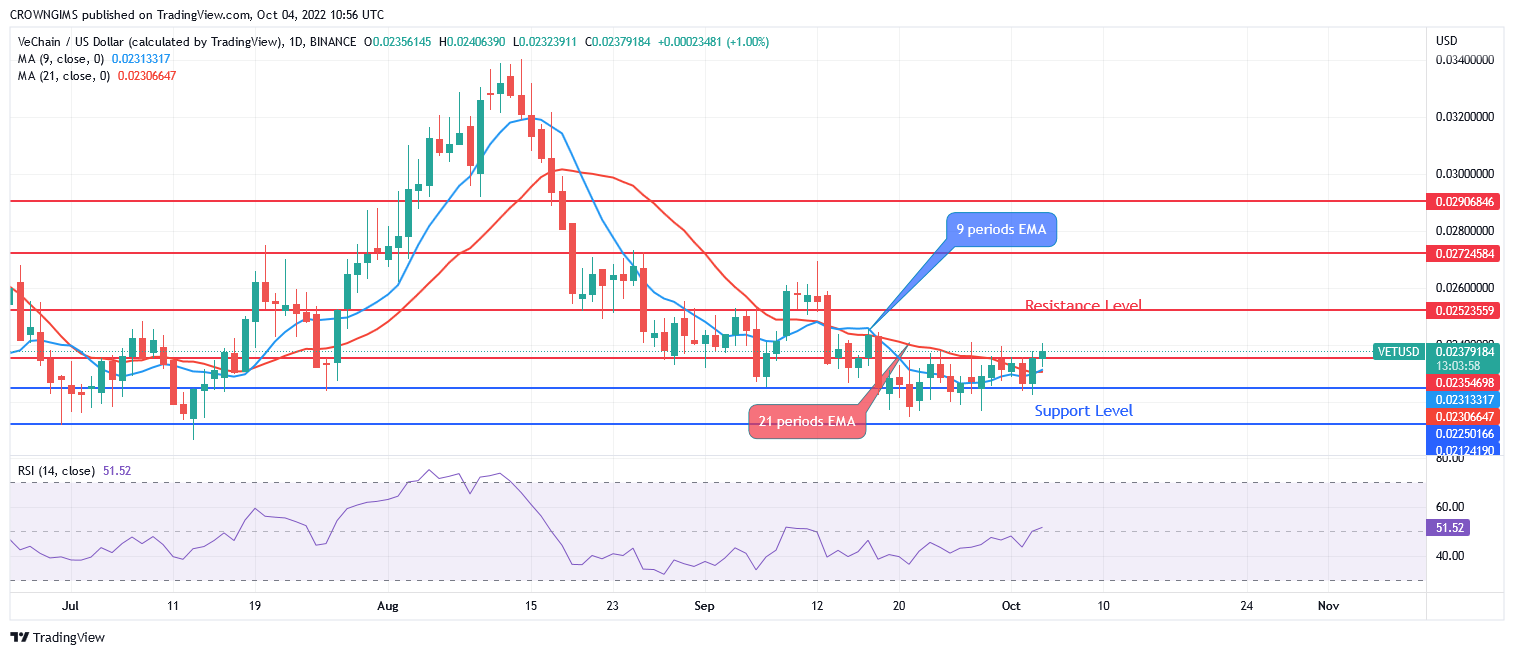
VeChain is on the ranging movement in the daily chart. Since August 13, the coin has been obeying the command of the sellers. Their pressure increased and the price found support at $0.022 level. The bears’ momentum become weak and it could not decrease further. Likewise, the buyers’ pressure is not enough to break up the resistance level of $0.025; hence, price commenced a ranging movement within the just mentioned levels.
On the daily chart, Bulls are trying to take over the VET/USD market as the daily bullish candle formed today. VeChain is breaking up $0.023 level, it may increase to $0.025, $0.027 and $0.029 resistance levels. The closing of the daily bearish candle below $0.023 level may drop the price at $0.022 and $0.021 levels. The relative strength index period 14 is at 51 level pointing upside to indicate buy signal.
Your capital is at risk
VET/USD Medium-term Trend: Ranging
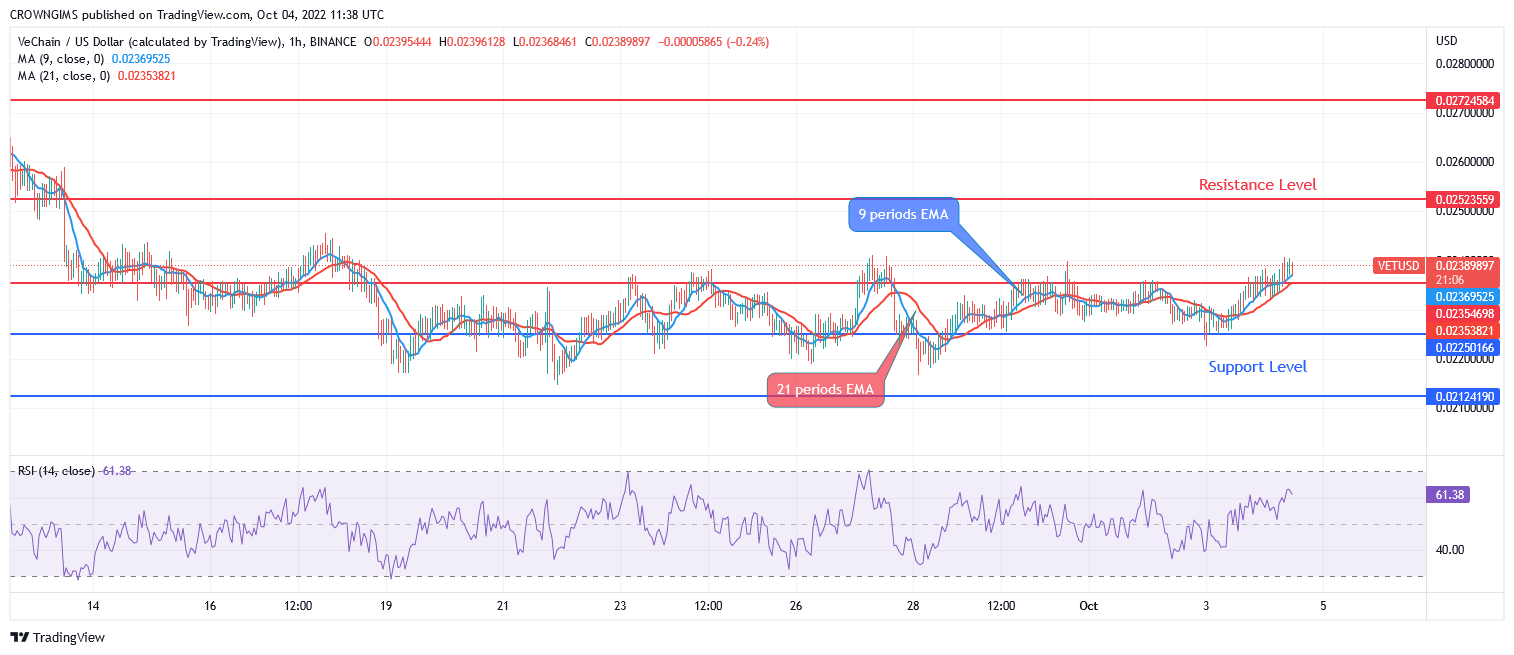
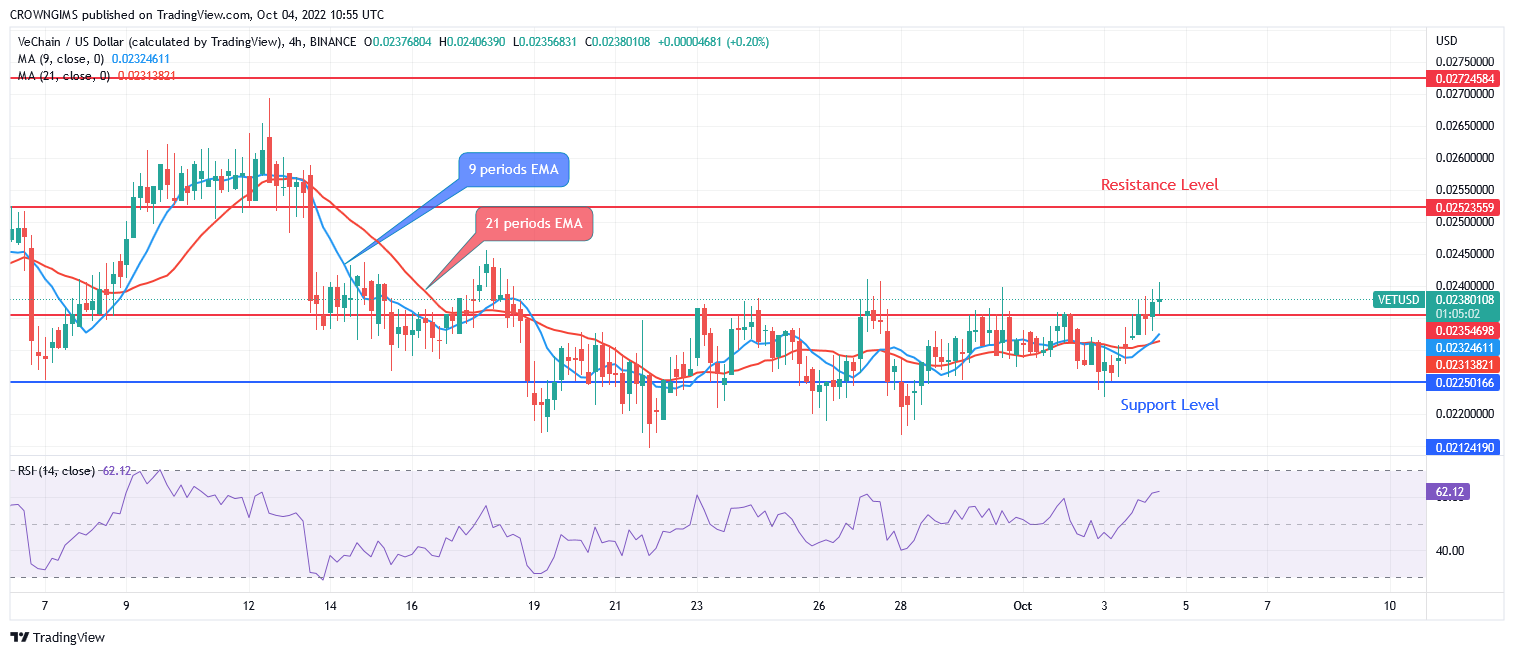
VeChain is ranging in the medium time frame. The price is range-bound within the $0.025 and $0.023 levels. This scenario is as a result of low bullish and low bearish momentum in Vechain market. A breakout at the resistance level of $0.025 level may push the coin far towards $0.029. Consolidation continues until there is a breakout towards north or south.
The coin may likely move above the resistance level at $0.025. The Relative Strength Index period 14 indicator is bending towards north at 64 levels indicate buy signal.
Join Our Telegram channel to stay up to date on breaking news coverage
