
Join Our Telegram channel to stay up to date on breaking news coverage
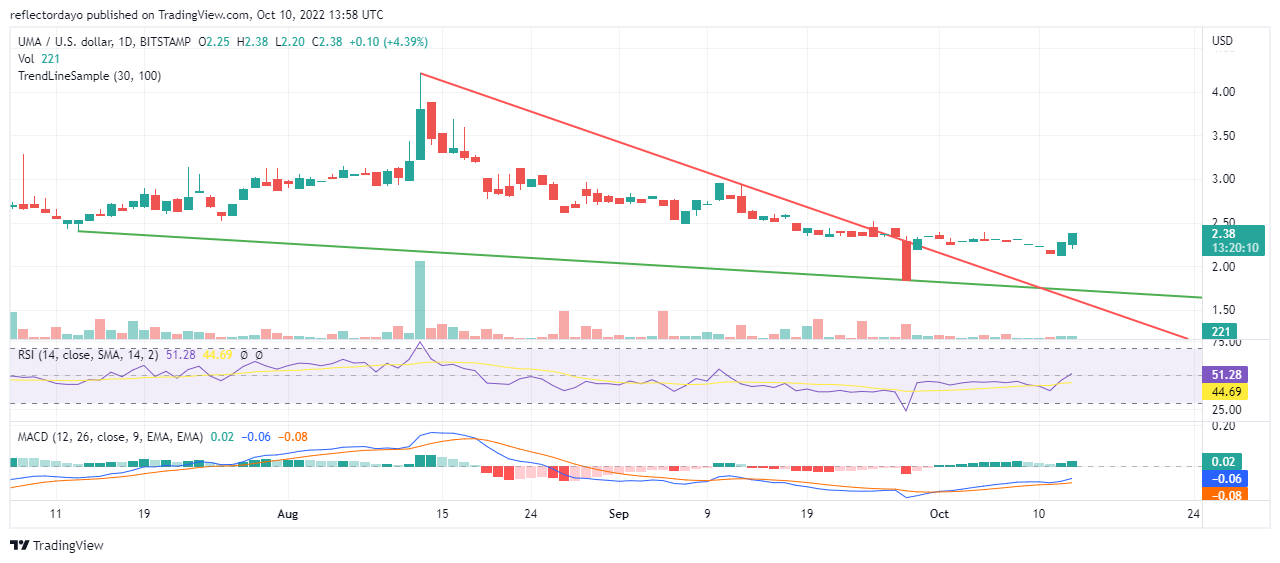
On the 13th of August, when the price of the Universal market reached the height of $4.22, traders began to take their profit. On that day the price rose from $3.25 to $4.22, but (in that same trading session) the price dropped to 3.81. This price pullback of that day triggered the trend reversal and the bears reigned continuously since then. The bearish trend went on until the 28th of September. On this day, the bearish move was very strong and the market settled at the $1.81 support level. Like before, this strong bearish move triggered the bullish trend. On the 29th of September, the market witnessed a very bullish move. But from the 30th of September, the bulls could not push the price up further.
Universal Market Price Statistic:
- UMA/USD price now: $2.23
- UMA/USD market cap: $148,549,132
- UMA/USD circulating supply: 68,947,415
- UMA/USD total supply: 101,172,570
- UMA/USD coin market ranking: #151
Key Levels
- Resistance: $ 2.50 $2.70 $3.00
- Support: $2.00, $1.50 $1.00
Your capital is at risk
Universal Market Price Analysis: The Indicators’ Point of View
The flat market lasted for 8 days (that is from the 3rd of October to the 10th of October). The Market was characterised by the 4-price doji candlestick pattern which signifies a high level of indecision in the market. Also, the volume of trade for those days was very low. But the market began to move decisively in a bullish way from yesterday (the 12th of September) and this spilt over into today’s market as the bulls continue to drive the price of Universal market. The Trend line indicator formed a falling wedge triangle pattern. This triangle trendline pattern points to an imminent bullish trend. And this is what we are seeing playing out on the chart. The market is trending up.
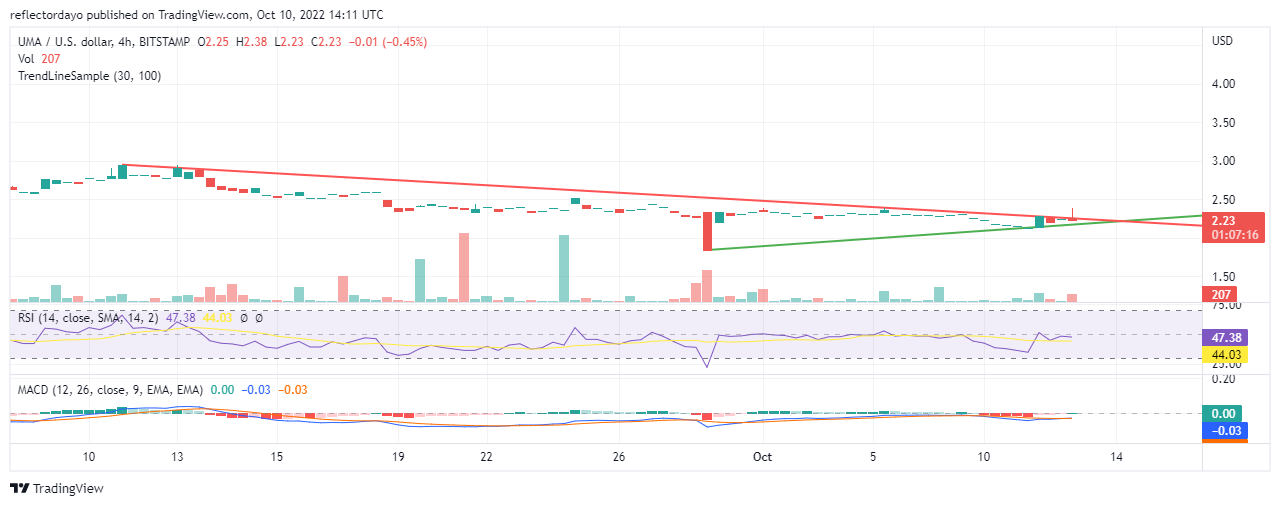
UMA/USD 4-Hour Chart Outlook
From this point of view, the bullish trend recovery is more visible. The RSI line has recovered from the bearish zone into the bullish zone, measuring 58%. The MACD line has crossed the signal line in the bearish market zone of the indicator and it is now facing an upward direction to cross out of the zone. Also, a bullish histogram as appeared on the chart. This market still has a long way to go if it must recover in a bullish way.
Join Our Telegram channel to stay up to date on breaking news coverage