Join Our Telegram channel to stay up to date on breaking news coverage
The Universal Market Access price prediction shows that UMA may cross above the channel to hit the $2.50 resistance level.
Universal Market Access Prediction Statistics Data:
- Universal Market Access price now – $2.13
- Universal Market Access market cap – $151.7 million
- Universal Market Access circulating supply – 71.1 Million
- Universal Market Access total supply – 113.4 million
- Universal Market Access Coinmarketcap ranking – #178
UMA/USD Market
Key Levels:
Resistance levels: $2.80, $3.00, $3.20
Support levels: $1.50, $1.48, $1.46
UMA/USD bulls are trying to push the coin above the upper boundary of the channel as the technical indicator Relative Strength Index (14) reveals that the market may embark on a positive movement as the signal line moves to cross above the 60-level.
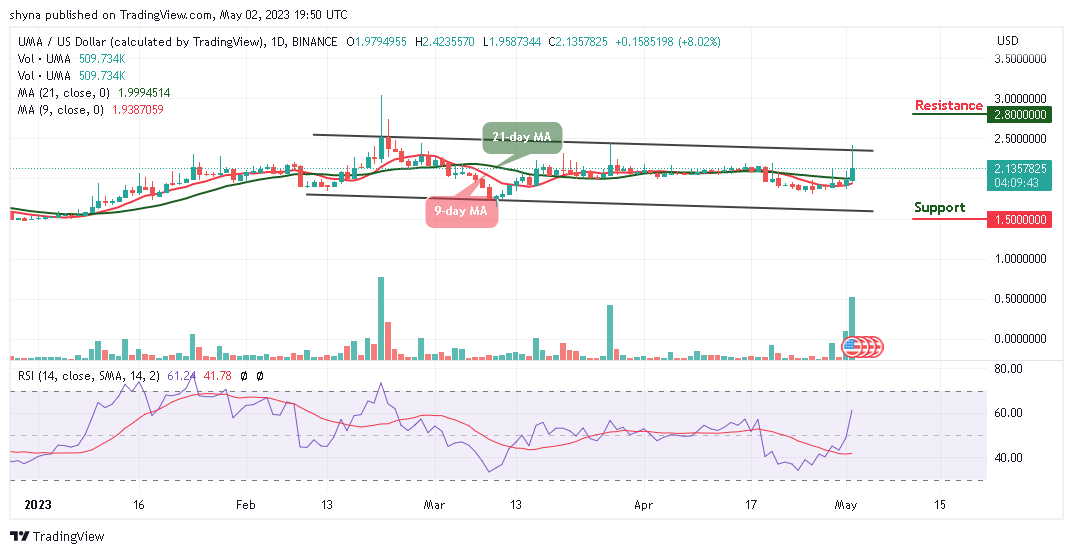
Universal Market Access Price Prediction: UMA Price May Follow the Uptrend
The Universal Market Access price is changing hands at $2.13 where it faces up. If the coin breaks above the channel, the coin may begin the upward movement. However, any further bullish movement may locate the nearest resistance levels at $2.80, $3.00, and $3.20, while sliding below the 9-day and 21-day moving averages could reach the support levels of $1.50, $1.48, and $1.46 respectively with a long bullish trading volume.
Against Bitcoin, the Universal Market Access price is moving above the 9-day and 21-day moving averages as the bulls hover above the upper boundary of the channel. On the downside, if the market price fall and drops toward the lower boundary of the channel, the next support level may surface at 700 SAT to locate further key support at 600 SAT and below if the sell-off later becomes huge.
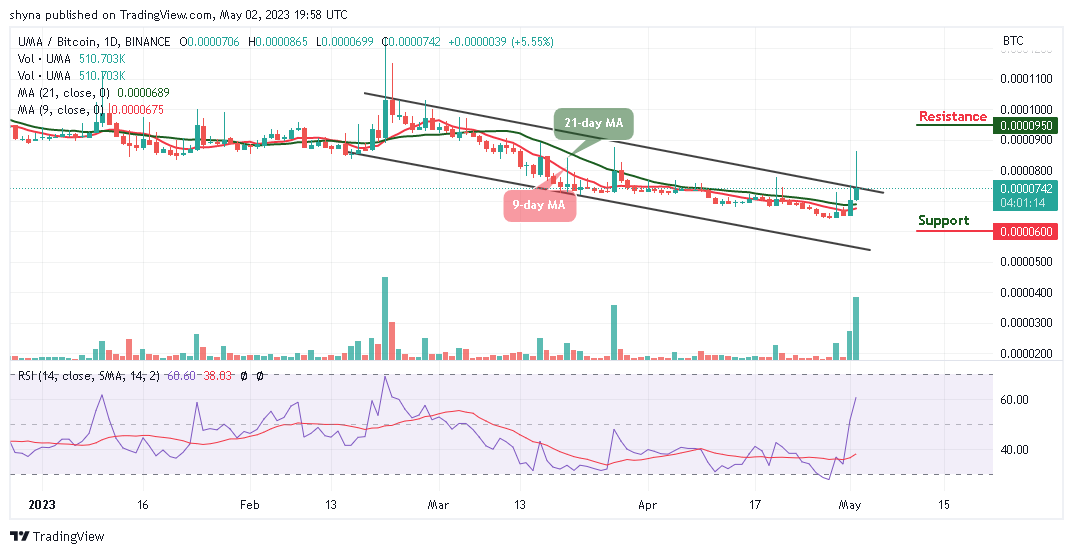
On the upside, if the bulls keep the price above the upper boundary of the channel; further bullish movement may hit the potential resistance level at 950 SAT and above while the signal line of the Relative Strength Index (14) moves to cross above the 60-level to continue the bullish movement. On the other hand, if it moves below the opening price of 706 SAT, sellers may resume back and this could increase the bearish movement into the market.
Universal Market Access Alternatives
According to the daily chart, the Universal Market Access price is moving towards the resistance level of $2.50 as the initial move to cross the upper boundary of the channel could boost the price further up. From above, more bullish movements may come into play if the Universal Market Access price stays above the moving averages as the nearest resistance level could be found at $2.50. Meanwhile, Love Hate Inu distinguishes itself from other meme coins due to its versatile accurate survey and poll results powered by the Ethereum blockchain – giving it a real-life utility beneficial to the global industry, the presale is still on as it has raised close to $11m in the presale.
Join Our Telegram channel to stay up to date on breaking news coverage