Join Our Telegram channel to stay up to date on breaking news coverage
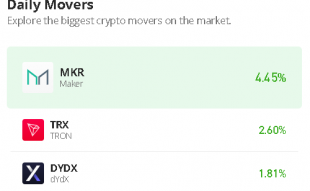
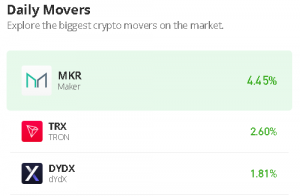
The Tron (TRX) price prediction may continue to settle above the 9-day and 21-day moving averages as the coin heads to the upside.
Tron Prediction Statistics Data:
- Tron price now – $0.064
- Tron market cap – $5.8 billion
- Tron circulating supply – 92.3 million
- Tron total supply – 92.3 million
- Tron Coinmarketcap ranking – #15
TRX/USD Market
Key Levels:
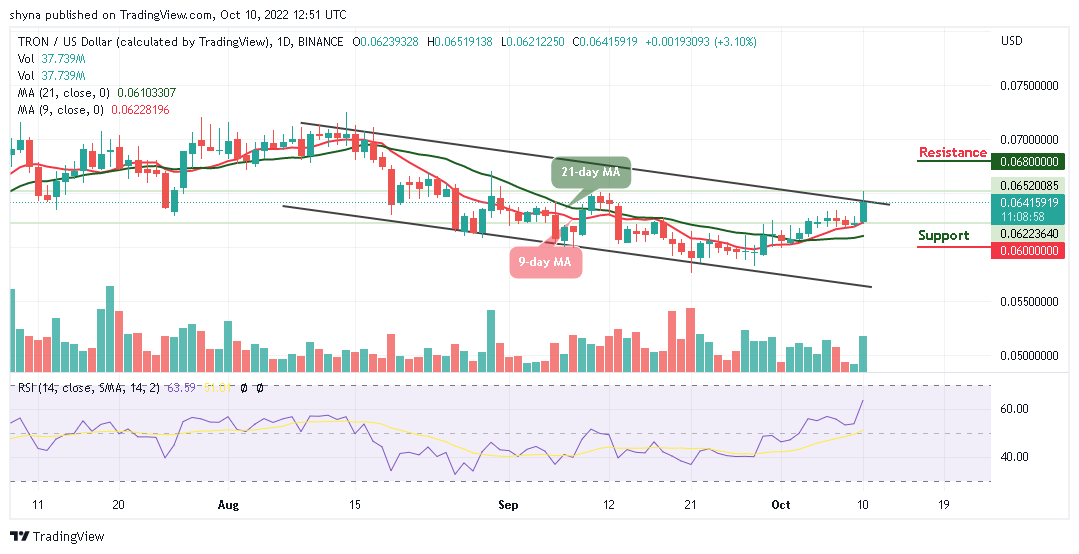
Resistance levels: $0.068, $0.070, $0.072
Support levels: $0.060, $0.058, $0.056
Your capital is at risk
TRX/USD continues to trade above the 9-day and 21-day moving averages within the channel. The cryptocurrency is trying to create a higher ground above the resistance level of $0.065, and should the buyers keep the coin above the moving averages, it may remain on the upside. Today, an early trading session makes the Tron price touch the $0.065 level before rebounding to where it is trading currently at $0.064.
Tron Price Prediction: What Could be the Next Direction for Tron?
The Tron price may stay above the moving averages and if the resistance of $0.065 gives way, the Bull Run may come to focus, and the coin may create an additional bullish trend. Now, the bullish scenario seems to surface as buyers continue to post firm commitments into the market. According to the daily chart, traders could see another rise in the market price. Therefore, if the coin crosses above the upper boundary of the channel, it could further strengthen the market to the resistance levels of $0.068, $0.070, and $0.072 respectively.
On the downside, a lower possible swing may likely retest the previous support below the 9-day moving average. However, if the sellers manage to fuel the market, traders may expect a further drop to the support levels of $0.060, $0.058, and $0.056 respectively. On the other hand, the technical indicator Relative Strength Index (14) is now moving towards 70-level, indicating that the market may retain the bullish trend.
Compared with Bitcoin, the Tron price remains above the 9-day and 21-day moving averages in other to reach the resistance level of 340 SAT. However, this resistance level is expected to effectively exceed so that the market price may end up closing above it.

On the other hand, if TRX/BTC trades below the moving averages, it could refresh lows under 319 SAT and a possible bearish continuation may likely meet the major support at 300 SAT and below but if the coin moves above the upper boundary of the channel, it could hit the potential resistance at 360 SAT and above. However, the technical indicator Relative Strength Index (14) is moving above the 60-level, indicating that the market may give more bullish signals.
Join Our Telegram channel to stay up to date on breaking news coverage