Join Our Telegram channel to stay up to date on breaking news coverage
According to the daily chart, the Tron price prediction reveals that TRX may face key support as the coin keeps heading to the south.
Tron Prediction Statistics Data:
- Tron price now – $0.061
- Tron market cap – $5.6 billion
- Tron circulating supply – 92.3 million
- Tron total supply – 92.3 million
- Tron Coinmarketcap ranking – #15
TRX/USD Market
Key Levels:
Resistance levels: $0.065, $0.067, $0.069
Support levels: $0.058, $0.056, $0.054
Your capital is at risk
At the time of writing, TRX/USD drops with a bearish bias after touching the daily high at $0.0611. The coin opens at $0.0611, and it is currently trading at the $0.0610 level. For the past few days, the Tron price did start a nasty decline and has been trying to follow the bullish movement. The market price could correct higher, but it is likely to face more sellers below the 9-day and 21-day moving averages.
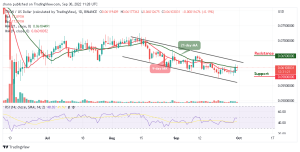
Tron Price Prediction: Tron (TRX) May Break More Downsides
The Tron price is likely to break to the downside and the coin could break down heavily to gain more downtrends. At the time of writing, TRX/USD is hovering at $0.0610 as it prepares to cross above the 21-day moving average. Should it slide below the 9-day moving average, the critical support levels of $0.058, $0.056, and $0.054 could be reached while the technical indicator Relative Strength Index (14) remains below the 50-level.
Nevertheless, TRX/USD could either recover above $0.062 or extend its decline towards the support level of $0.060. On the upside, the next major resistance is near the $0.063 level. Meanwhile, the price needs to climb above $0.064 for it to hit the potential resistance levels of $0.065, $0.067, and $0.069. If not, there is a risk of more downsides towards the lower boundary of the channel.
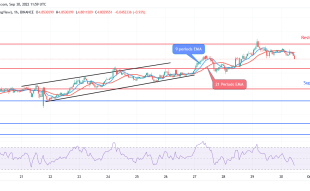
Against Bitcoin, the daily chart reveals that the Tron price is hovering around the 9-day moving average. If the price heads toward the upper boundary of the channel, there is a possibility that the coin will begin another upward movement. However, if the price increases, it could even break the 350 SAT and above in future sessions.
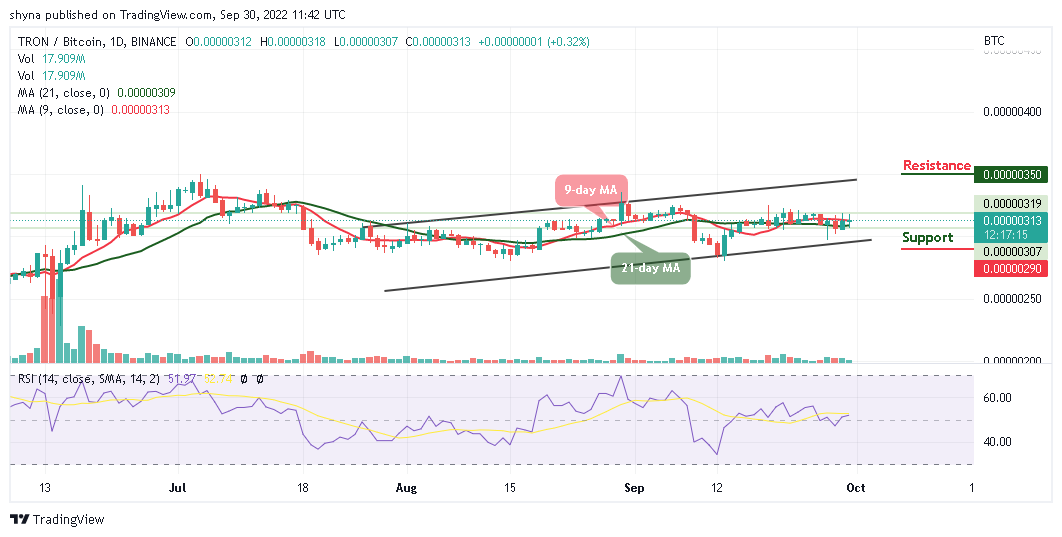
In other words, if the bears bring the price below the 21-day moving average and drop towards the lower boundary of the channel, 300 SAT support may play out. Any further bearish movement could roll the coin to critical support at 290 SAT and below. Meanwhile, the market may continue to trade averagely as the Relative Strength Index (14) stays above the 50-level.
Join Our Telegram channel to stay up to date on breaking news coverage