Join Our Telegram channel to stay up to date on breaking news coverage
The Maker price prediction shows that MKR may head to the downside as the price is down by 5.04% over the last 24 hours.
Maker Prediction Statistics Data:
- Maker price now – $925
- Maker market cap – $901 million
- Maker circulating supply – 977.6 thousand
- Maker total supply – 977.6 thousand
- Maker Coinmarketcap ranking – #52
MKR/USD Market
Key Levels:
Resistance levels: $1200, $1300, $1400
Support levels: $800, $700, $600

Your capital is at risk
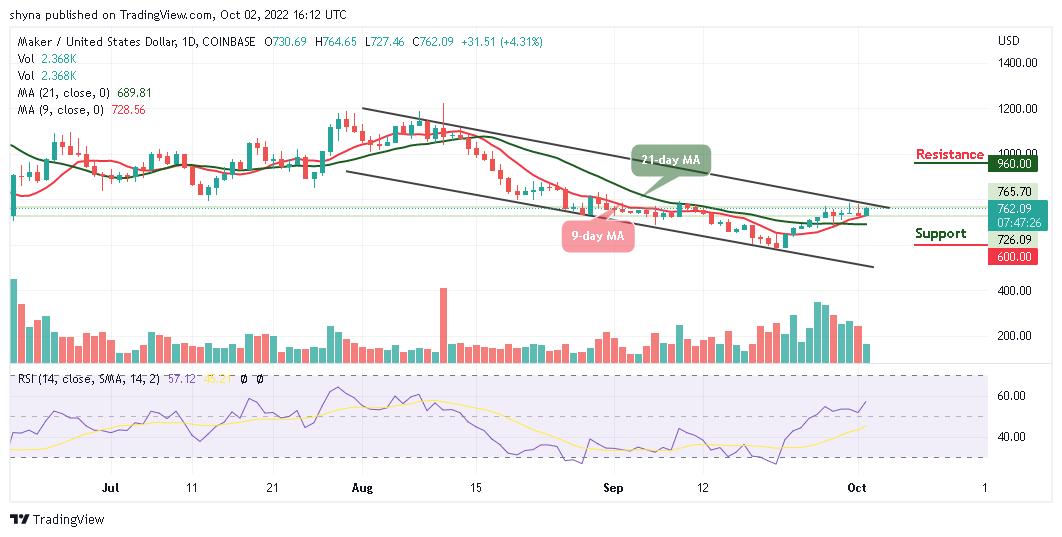
MKR/USD may continue to drop lower if the coin slide below the 9-day moving average. During the European session, the Maker (MKR) failed to cross above the upper boundary of the channel as the coin falls back below the daily high of $976 level. At the moment, if the bears push the market further lower, immediate support below the $900 level may be located. Beneath this, further support could be found at $800, $700, and $600 respectively.
Maker Price Analysis: MKR Price Heads to the Downside
If the buyers can revisit the resistance level of $976 and the Maker price begins to climb higher, bulls may expect immediate resistance to be located at $1000 resistance, which is above the upper boundary of the channel. However, moving a little bit higher may locate the higher resistance levels at $1200, $1300, and $1400. Meanwhile, the technical indicator Relative Strength Index (14) is likely to cross below the 70-level, which shows that the market may follow the bearish movement.
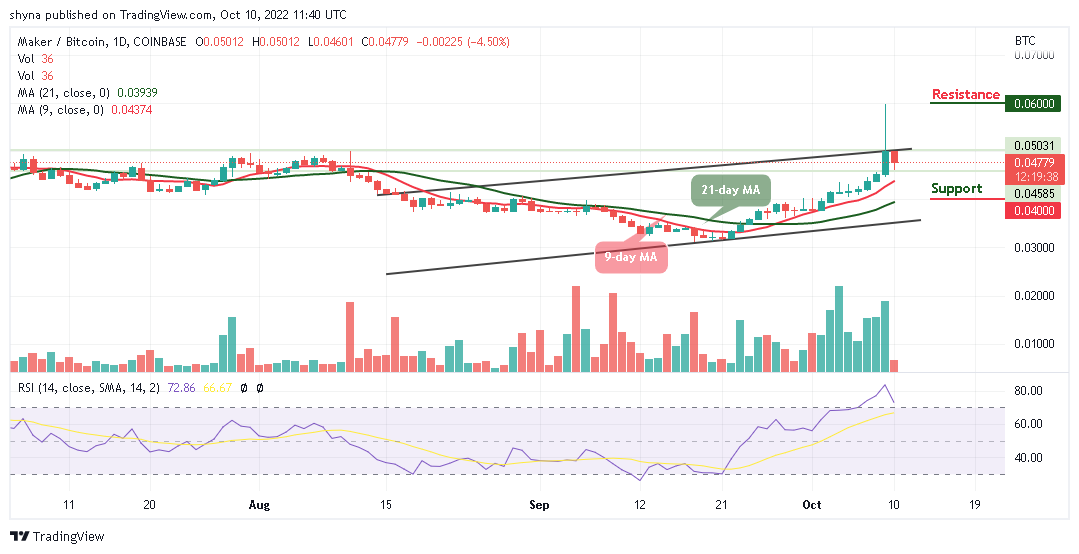
Against Bitcoin, the Maker is sliding towards the 9-day and 21-day moving averages. Therefore, if the coin crosses below this barrier, the Maker (MKR) may perpetually be under the control of a bear. Meanwhile, traders need more strong and more consistent resistance to keep the price from the bear run.

However, with the current movement in the daily chart, if the price crosses above the upper boundary of the channel, it may likely reach the potential resistance level at 6000 SAT and above. On the contrary, if the market price heads toward the lower boundary of the channel, it could hit the critical support at 4000 SAT and below as the technical indicator Relative Strength Index (14) prepares to move away from the overbought region.
Join Our Telegram channel to stay up to date on breaking news coverage


