
Join Our Telegram channel to stay up to date on breaking news coverage
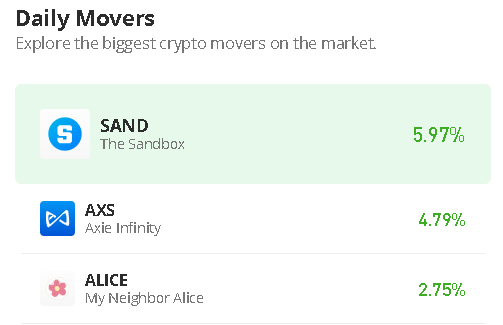
The Sandbox price prediction shows that SAND may cross into the positive side if the price crosses above the channel.
The Sandbox Prediction Statistics Data:
- The Sandbox price now – is $0.83
- The Sandbox market cap – is $1.2 billion
- The Sandbox circulating supply – 1.4 billion
- The Sandbox total supply – 3 billion
- The Sandbox Coinmarketcap ranking – #43
SAND/USD Market
Key Levels:
Resistance levels: $1.20, $1.30, $1.40
Support levels: $0.60, $0.50, $0.40
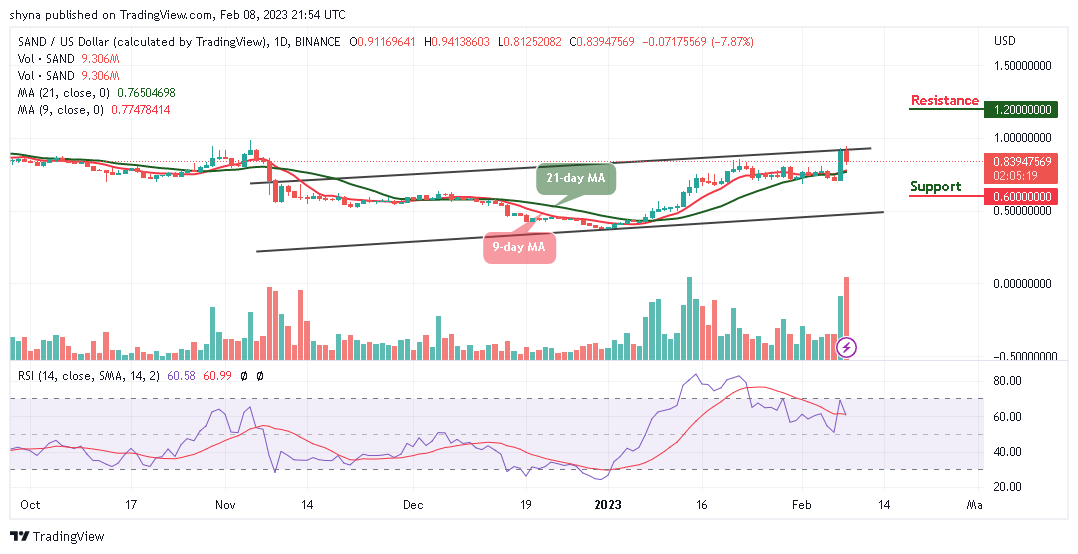
SAND/USD price may drop lower if the coin finds support at the $0.80 level but during the European session today, The Sandbox (SAND) tried to cross above the upper boundary of the channel before falling back to where it is currently trading at the $0.83 level. Therefore, if bears continue to push the market further lower, immediate support below the $0.75 level may be located. Beneath this, further supports may be found at $0.60, $0.50, and $0.40 respectively.
The Sandbox Price Prediction: SAND Price May Consolidate
As the daily chart reveals, if the buyers can hold the support at $0.80 and the Sandbox price begins to climb higher, bulls may expect immediate resistance to be located at $1.00, which is above the upper boundary of the channel. However, moving a little bit higher may locate the higher resistance levels at $1.20, $1.30, and $1.40. Meanwhile, the technical indicator Relative Strength Index (14) is seen ranging above the 60-level, which shows that the market may follow a sideways movement.
Against Bitcoin, The Sandbox is heading toward the 9-day and 21-day moving average but, if the price crosses below this barrier; SAND/BTC may perpetually be under the control of a bear. Meanwhile, traders need more strong and more consistent resistance to keep the price from the bear run.
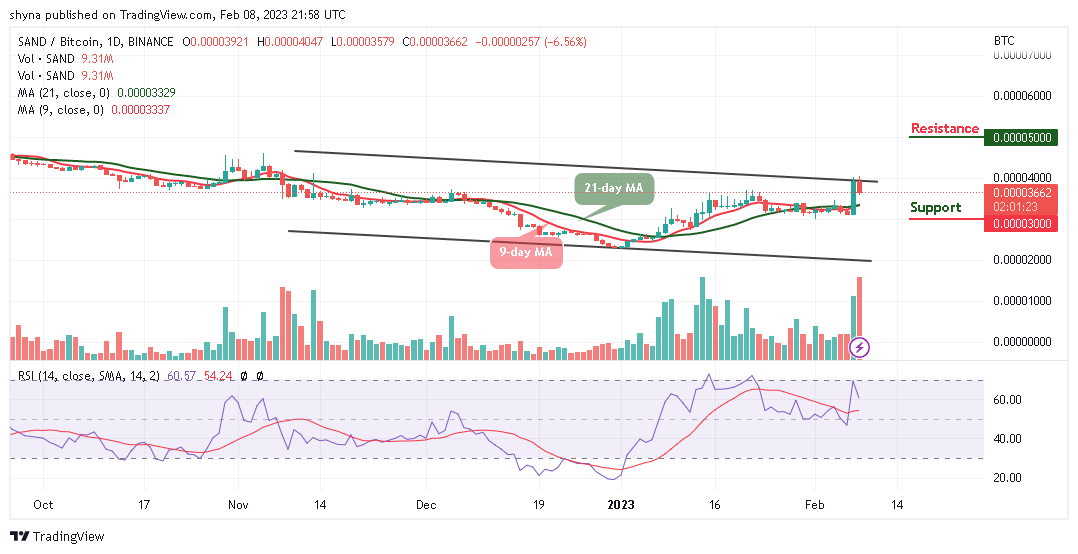
However, with the current movement in the daily chart, if the price crosses above the upper boundary of the channel, it could reach the potential resistance level at 5000 SAT and above. Meanwhile, if the market price heads toward the lower boundary of the channel, it may hit the critical support at 3000 SAT and below as the technical indicator Relative Strength Index (14) moves to cross below the 60-level.
The Sandbox Alternatives
The Sandbox price is holding the $0.80 support and might attempt a fresh increase but, if the coin fails to clear the $1.00 resistance, it could begin to move down and the initial support on the downside could hit the support at $0.80 level. However, the play-to-earn games platform, MEMAG is a platform that puts the quality and replayability of its games ahead of tokenization and rewards mechanics, they have raised almost $4 million in its presale so far.
Join Our Telegram channel to stay up to date on breaking news coverage