Join Our Telegram channel to stay up to date on breaking news coverage
The Tezos price prediction renews the bullish trend after crossing above the 9-day moving average to touch the daily high at $0.80.
Tezos Prediction Statistics Data:
- Tezos price now – $0.71
- Tezos market cap – $677 million
- Tezos circulating supply – 941 million
- Tezos total supply – 962 million
- Tezos Coinmarketcap ranking – #54
XTZ/USD Market
Key Levels:
Resistance levels: $0.95, $1.05, $1.15
Support levels: $0.50, $0.40, $0.30
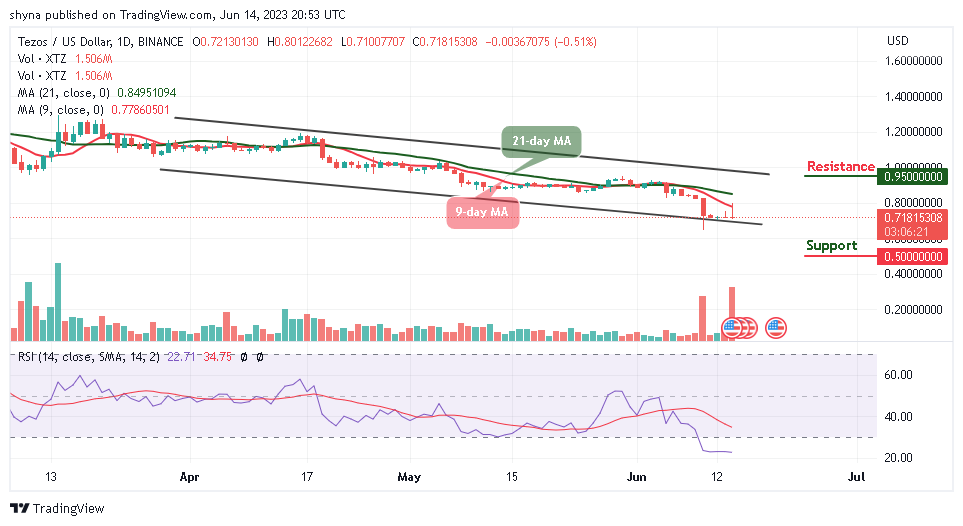
XTZ/USD spikes to touch the resistance level of $0.80 as the coin heads toward the upper boundary of the channel. After touching the daily high at $0.80, the coin retreats below the 9-day moving average, hovering around the $0.71 level. However, a possible bullish cross above the 21-day moving average may push the coin on the higher side.
Tezos Price Prediction: Tezos (XTZ) Could Face the Higher Side
At the moment, the Tezos price could begin to recover toward the resistance level of $0.85. Meanwhile, the initial break above the 9-day moving average boosted the price up; the Tezos (XTZ) could have created additional highs if the coin crossed above the 21-day moving average.
Nevertheless, the trend remains in the hands of the bears supported by the technical indicator where the Relative Strength Index (14) hovering within the overbought region, Meanwhile, a break above $0.80 and $0.90 resistance levels could push the coin to hit the potential resistance levels of $0.95, $1.05, and $1.15 while a break below the lower boundary of the channel could lead to the supports of $0.50, $0.40, and $0.30 respectively.
Against Bitcoin, the Tezos price is heading to the upside as the coin crosses above the 9-day moving average. However, if the coin slide below the lower boundary of the channel, the bears are likely to step back into the market; breaking any further downside could take the price to the support level of 2200 SAT and below.
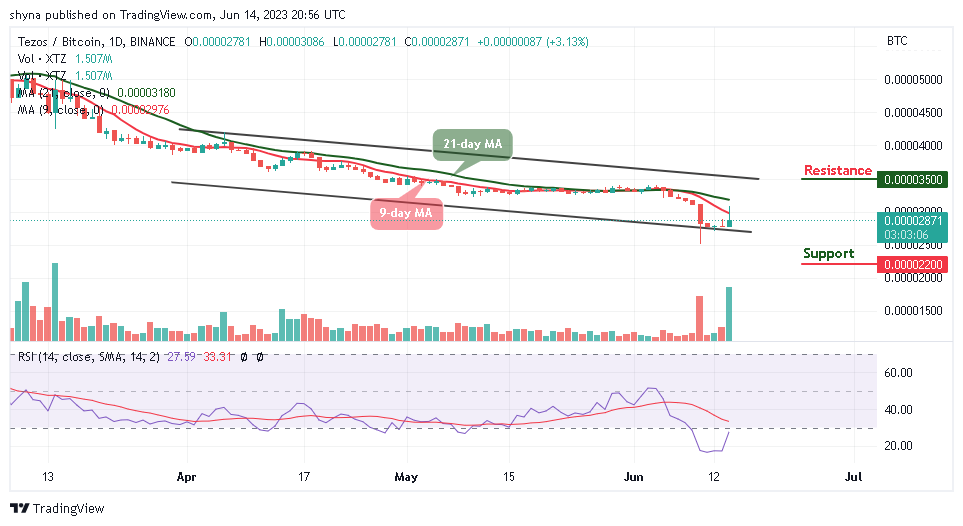
However, if the coin continues to follow the uptrend, crossing above the upper boundary of the channel could bring it to the potential resistance level of 3500 SAT and above. Meanwhile, the technical indicator Relative Strength Index (14) is moving to cross above the 30-level, which could suggest more bullish signals in the market.
Tezos Alternatives
The Tezos price on the daily chart showcases the crypto economy appearing and getting set for swing highs above the 9-day and 21-day moving averages. However, the XTZ/USD market buyers are to exercise caution by avoiding opening a buying order when the market tends to result in a correction below the 9-day moving average, possibly in no time. Meanwhile, it is important to know that the Wall Street Memes (WSM) token is still very hot at the moment. Investors are encouraged not to miss this opportunity for any reason as the presale is still live, and close to $7 million has been realized so far.
New OKX Listing - Wall Street Memes
- Established Community of Stocks & Crypto Traders
- Featured on Cointelegraph, CoinMarketCap, Yahoo Finance
- Rated Best Crypto to Buy Now In Meme Coin Sector
- Team Behind OpenSea NFT Collection - Wall St Bulls
- Tweets Replied to by Elon Musk
Join Our Telegram channel to stay up to date on breaking news coverage
