Join Our Telegram channel to stay up to date on breaking news coverage
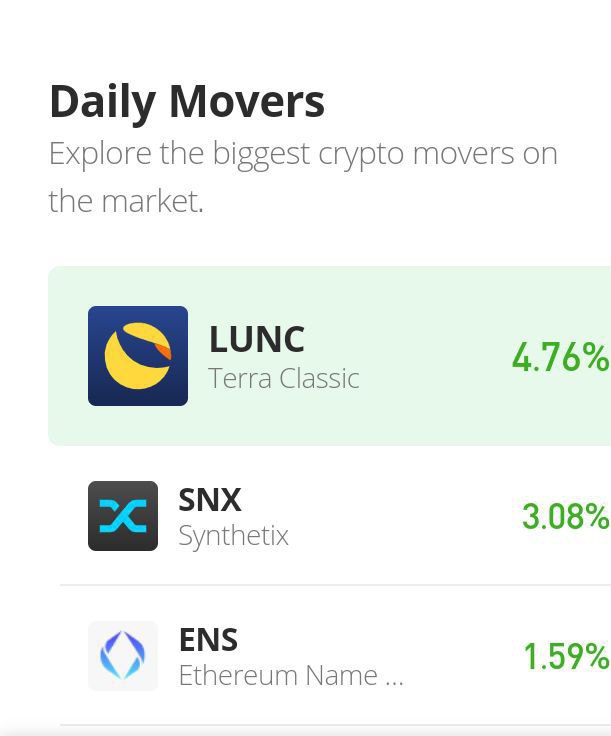
Terra Classic (LUNC) Price Prediction – September 1
The LUNC market shoots up through resistance of variant levels against the trade worth of the US Dollar. In the last thirty days, the crypto economy has been within a low and a high of $0.00007154 and $0.0002437 value lines. As of the time of writing, the price is at $0.0002252 with positive signs on most indicators.
Terra Classic (LUNC) Price Statistics:
LUNC price now – $0.0002252
LUNC market cap – $1.5 billion
LUNC circulating supply – 6.6 trillion
LUNC total supply – 6.9 trillion
Coinmarketcap ranking – #208
LUNC/USD Market
Key Levels:
Resistance levels: $0.00025, $0.00027, $0.00029
Support levels: $0.00020, $0.00018, $0.00016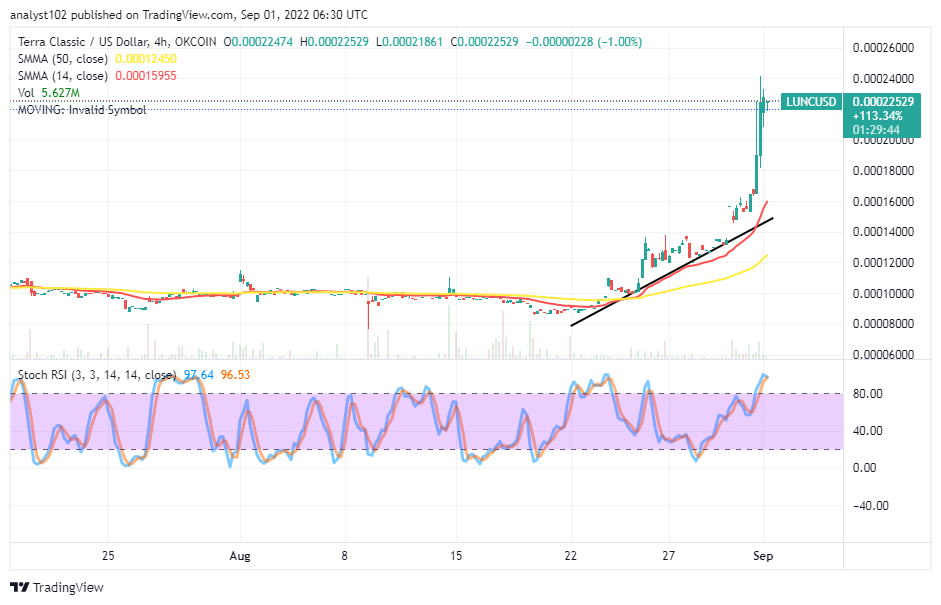 LUNC/USD – Lon-term Chart
The LUNC/USD long-term chart showcases the crypto market shoots up through variant resistances following a northward gap-moving mode that occurred during the August 30th trading session, which saw the value rising from around $0.0001350 to the high-value line as stated above. The 14-day SMA indicator is at $0.00015955 over the $0.00012450 value line of the 50-day SMA indicator. The Stochastic Oscillators are at 96.53and 97.64 range values.
Your capital is at risk.
Will the LUNC/USD market push sustainably above the high of $0.0002437 soon?
There are still fewer active forces to keep the LUNC/USD market around the high of $0.0002437 as the crypto’s price shoots up through differential resistances far above the trend lines of the SMAs. The bullish trend line drew below the psychological bottoms of the bullish trading candlesticks that form the path to the moon side. Today’s session has made the northward journey appears to be a straight line. A formation of a bearish candlestick sequence to the shooting manner around the $0.00025 resistance can potentially signify the resumption of a correction in the market. So, therefore, buyers needed to be wary of that presumption analytics playing out afterward.
On the downside of the LUNC/USD market’s technical analysis, sellers may exercise caution even though the price has been trading in an overbought condition. Some degrees of rejections are still required to take a pattern around the $0.00025 resistance trading line before a re-launching of shorting orders can execute.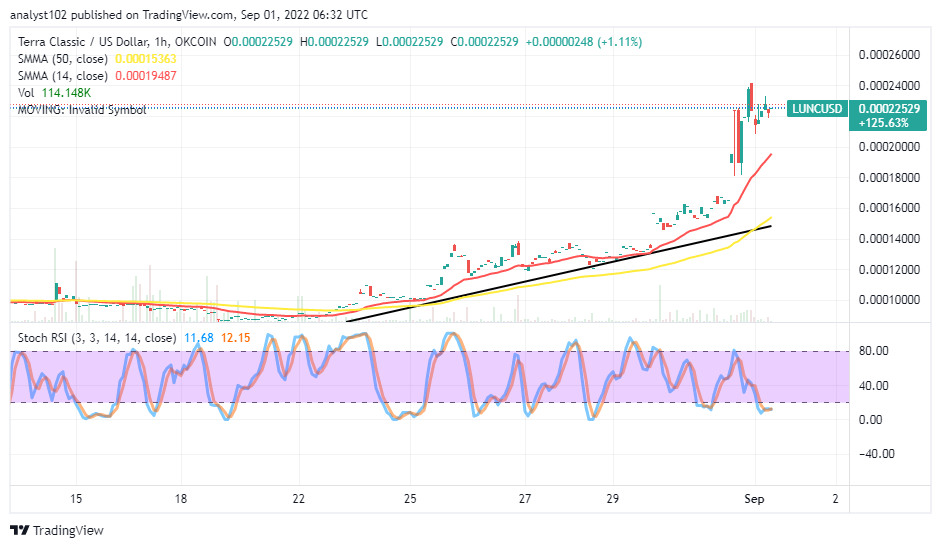
LUNC/USD Medium Chart
The LUNC/USD medium-term chart showcases the crypto market shooting up to break through some variant resistances far above the buy signal side of the SMAs. The 14-day SMA indicator is at $0.00019487 above the $0.00015363 value line of the 50-day SMA indicator. The Stochastic Oscillators are at a downside, maintaining 12.15 and 11.68 range values within the oversold region. Traders of all directions should be wary of their positions at this moment. But, investors seemingly have less to panic as they can add more to their portfolios to run on a long-term basis before cashing out part of their dividends or profits afterward.
Read more:
Join Our Telegram channel to stay up to date on breaking news coverage