Join Our Telegram channel to stay up to date on breaking news coverage
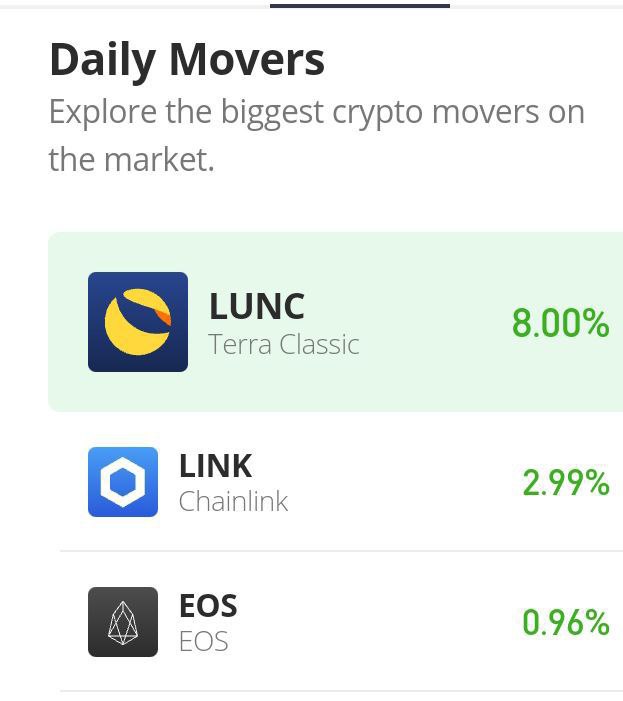
Terra Classic (LUNC) Price Prediction – September 16
In the recent operations, the Terra Classic market suffered corrections against the valuation of the US Dollar to a large extent that the situation has now led the crypto economy to settle for another bullish run at a lower-trading zone. Yesterday’s session recorded a low of $0.0002438 and a high of $0.0003. Price is currently trading around the $0.0002828 line at an average percentage rate of 10.97 positives.
Terra Classic (LUNC) Price Statistics:
LUNC price now – $0.0002823
LUNC market cap – $1.7 billion
LUNC circulating supply – 6.2 trillion
LUNC total supply – 6.9 trillion
Coinmarketcap ranking – #32
LUNC/USD Market
Key Levels:
Resistance levels: $0.00035, $0.00040, $0.00045
Support levels: $0.0002, $0.00015, $0.0001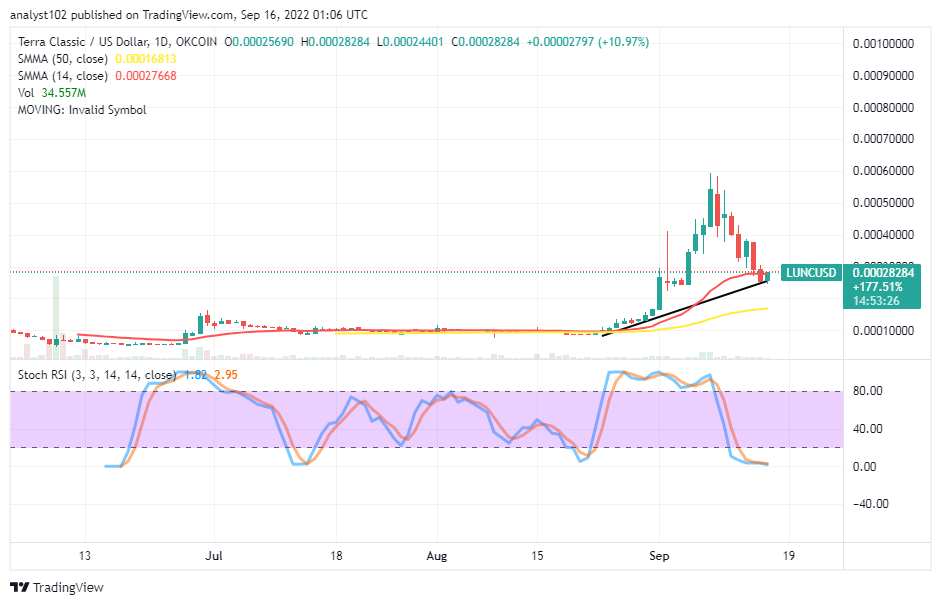 LUNC/USD – Lon-term Chart
The LUNC/USD long-term chart depicts the crypto-economic trade is settling for another bullish run at a lower-trading spot around the trend line of the smaller SMA. The 50-day SMA indicator is at $0.0001681, underneath the 14-day SMA indicator, which is at $0.0002767. The bullish trend line drew northwardly from the base of the $0.00010 support level to touch a point closely underneath the $0.00030 level, where the market can eventually build up energy. The Stochastic Oscillators are in the oversold region, briefly positioned southbound to touch the ranges of 2.95 and 1.82.
Your capital is at risk.
Which directional trading bias does the LUNC/USD market likely go soon afterward?
A different directional move to occur against the downward trend it has been maintaining over a couple of sessions as the LUNC/USD market is settling for another bullish run. With the emergence of a bullish candlestick, selling transactions are gradually losing stances around the trading trend line of the 14-day SMA. Long-position placers and investors may dim their fit to launch buying orders and add to the portfolio, while the price may tend to pull down toward the value line of the 50-day SMA at $0.0001681.
On the downside of the technical analysis, the reading position of the Stochastic Oscillators in the oversold region with the formation of a bullish candlestick shows that bears in this market have begun to stand a risk of losing momentum around the trend line of the smaller SMA. On the contrary, if a reverse has to surface against the upward motion, it can lead to a convergence around the $0.00020 support level for a while before running fully back into a bullish trend.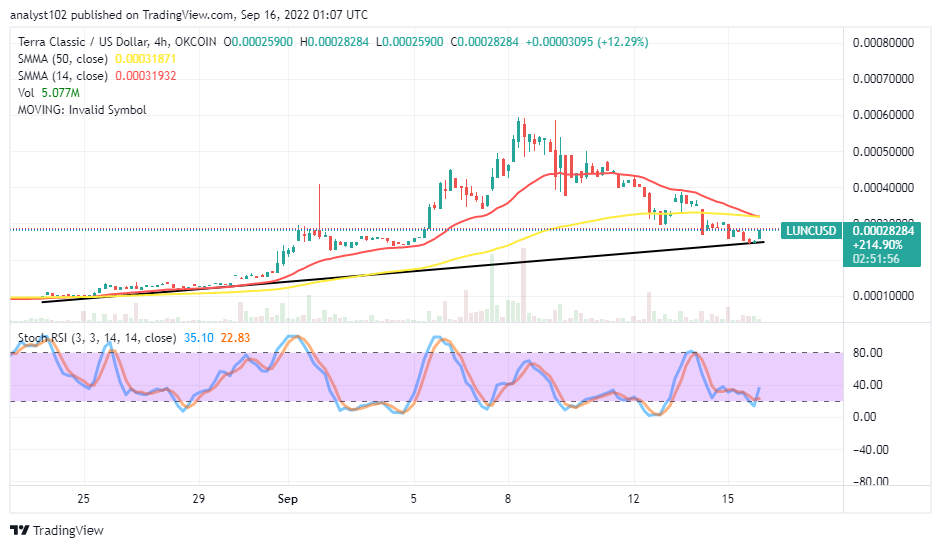
LUNC/USD Medium Chart
The LUNC/USD medium-term chart showcases the crypto economy is settling for another bullish run below the trend lines of the SMAs. Terra Classic’s trending ability, pairing with the US Dollar, has significantly moved into a correction mode. The 14-day SMA indicator has crossed southbound to touch the 50-day SMA indicator from the top. The combination of the SMA trading indicators reveals that the key resistance points of the current trading pace are around $0.0003187 and $0.0003193. The Stochastic Oscillators are seemingly attempting to cross northbound from the range of 20 as they are at 22.83 and 25.10 range values.
Read more:
Join Our Telegram channel to stay up to date on breaking news coverage