
Join Our Telegram channel to stay up to date on breaking news coverage
Terra Classic (LUNC) Price Prediction – September 8
The trading situation in the Terra Classic market looks geometrically bullish against the US fiat currency over a couple of sessions. Yesterday’s trading session featured the low and the high of $0.0003406 and $0.0004839 values-lines. A slight reversal move has produced a trading point of $0.00050076 at a negative of 14.07%.
Terra Classic (LUNC) Price Statistics:
LUNC price now – $0.00050076
LUNC market cap – $3.5 billion
LUNC circulating supply – 6.2 trillion
LUNC total supply – 6.9 trillion
Coinmarketcap ranking – #24
LUNC/USD Market
Key Levels:
Resistance levels: $0.00065, $0.00070, $0.00075
Support levels: $0.00040, $0.00035, $0.00030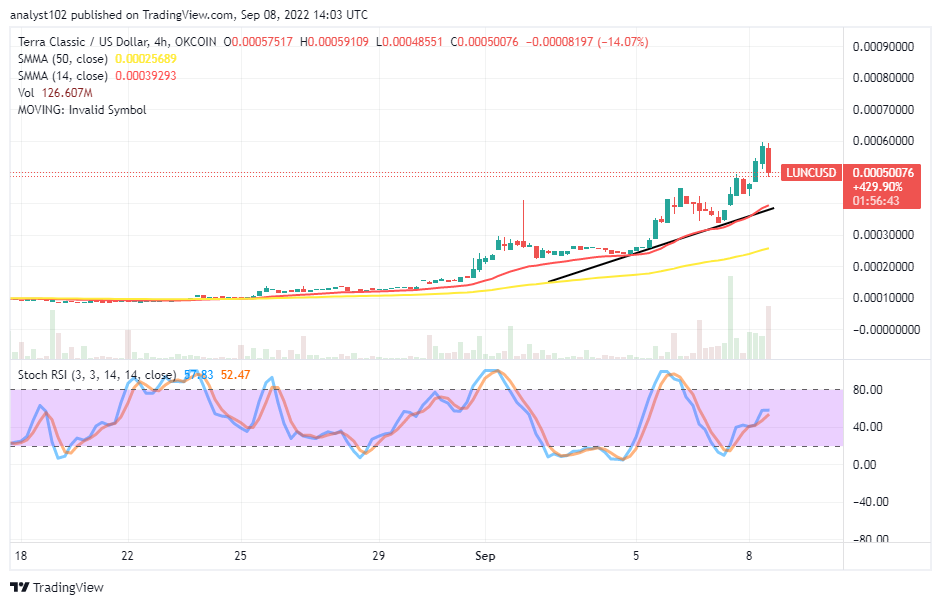 LUNC/USD – Lon-term Chart
The long-term chart reveals that the Terra Classic market looks geometrically bullish as it trades with the purchasing power of the US Dollar. The 14-day SMA indicator is at $0.00039293 above the $0.00025689 value point of the 50-day SMA indicator. The bullish trend line drew alongside the smaller SMA, marking the psychological bottoms each candlestick touched before making a bounce. The Stochastic Oscillators have traveled northbound to reach 52.47 and 57.83 range values. A bearish candlestick has denoted that a declining move is in progress.
Your capital is at risk.
To what level will it be technically ideal for the LUNC/USD market buyers to launch back?
The LUNC/USD market operation has been tremendously increasing over a session. And the crypto market still looks geometrically bullish to a great extent, as there has even though a reversal, which can potentially allow the price to rebuild its support around the $0.00040 level. At this point, long-position takers exercise caution, or they can launch a buy order limit between the support lines of $0.00040 and $0.00030.
On the downside of the technical analysis, the LUNC/USD market bears have to hold their positions tightly below the $0.00060 resistance by forming a sell wall around the bearish candlestick in the making. They need to be wary of further pushes northwardly against or above the value line. They need to avoid late execution of selling orders as better entry, which is around the resistance value line mentioned earlier.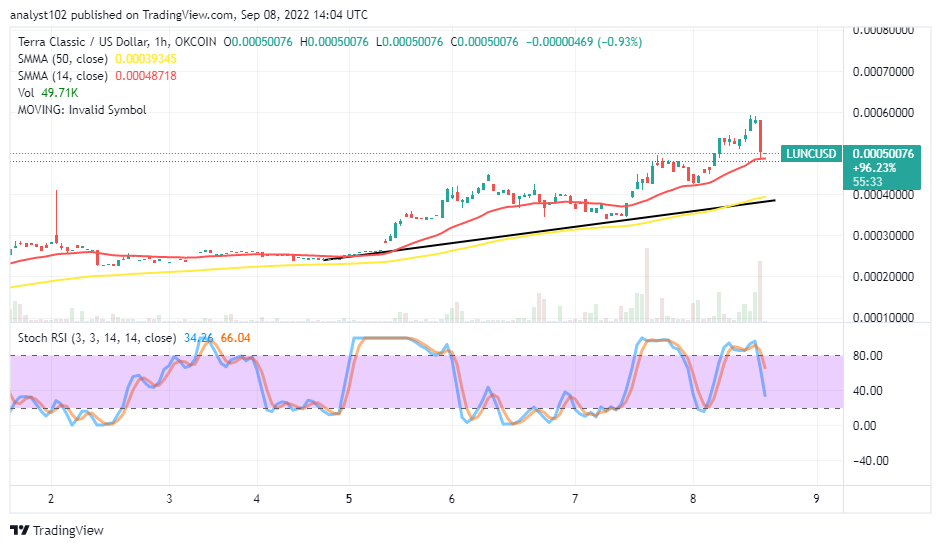
LUNC/USD Medium Chart
The medium-term chart reveals the LUNC/USD market looks geometrically bullish. But a long bearish candlestick has been spanning southward toward the smaller SMA. The 14-day SMA indicator is at $0.00048718 over the $0.00039345 value of the 50-day SMA indicator. The Stochastic Oscillators have crossed southbound to 66.04 and 34.26 range values. The bullish trend .line drew alongside the bigger SMA to mark the $0.00040 as the main support line where the price is likely to reverse before, making upward swings afterward again.
Read more:
Join Our Telegram channel to stay up to date on breaking news coverage