Join Our Telegram channel to stay up to date on breaking news coverage
Terra Classic (LUNC) Price Prediction – October 2
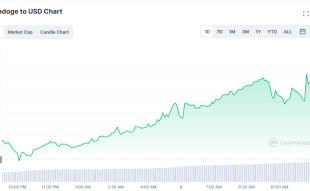
Today is the second-day trading session, observing the top trending crypto as the Terra Classic market remains the leading instrument among others until the moment. The LUNC/USD trade hikes toward the $0.0004 resistance point. The last several hours have produced high and low of $0.0003629 and $0.0002984 value lines at an appreciable positive percentage rate of 14.72.
Terra Classic (LUNC) Price Statistics:
LUNC price now – $0.0003363
LUNC market cap – $2.1 billion
LUNC circulating supply – 6.2 trillion
LUNC total supply – 6.9 trillion
Coinmarketcap ranking – #31
LUNC/USD Market
Key Levels:
Resistance levels: $0.0004, $0.00045, $0.0005
Support levels: $0.0003, $0.00025, $0.0002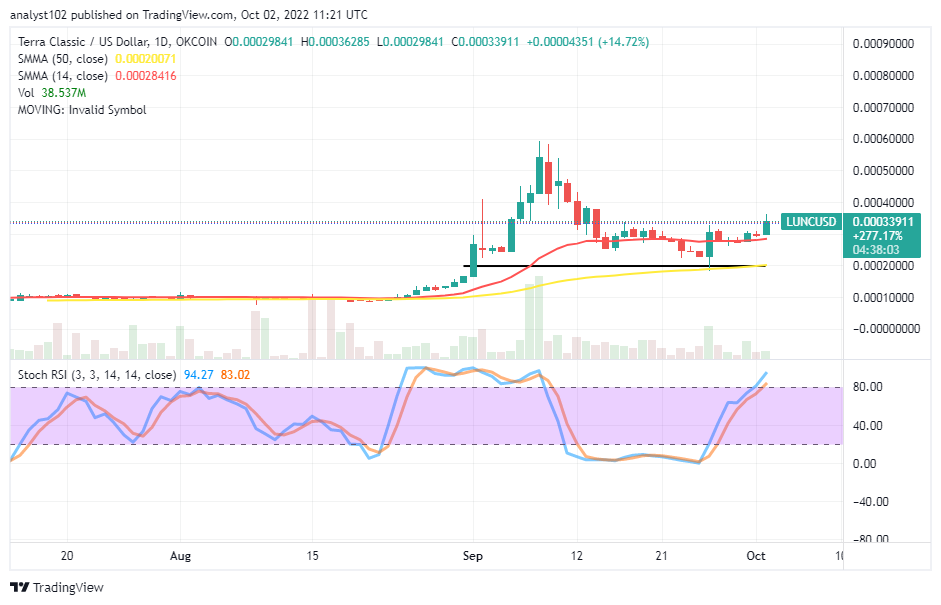 L/USD – Lon-term Chart
The LUNC/USD long-term chart showcases the crypto market hikes toward the $0.00040 resistance level. A bullish candlestick has formed on the buying signal side of the smaller SMA’s trend line. The 14-day SMA indicator is at $0.0002842, over the $0.0002007 value line of the 50-day SMA indicator. The Stochastic Oscillators are posing a warning signal against jumping along the trend at a high-trading zone as they are at 83.02 and 94.27 range points.
Your capital is at risk
Is it worth cautioning against launching more buying orders in the LUNC/USD trade around the 14-day SMA’s point?
Technically, it is worth cautioning against launching more buying orders in the LUNC/USD business operation by now, especially around the value line of the 14-day SMA, as though price hikes toward the $0.00040 resistance level. As of this time, bullish momentum is still in force with a slight reversal-moving mode to tell long-position placers to be wary of launching fresh buying orders at the current trading ability pace.
On the downside of the technical analysis, bears may find a better chance to push back against the LUNC/USD market valuation around the resistance of $0.00040. But, they would have to be patient until a kind of convergence occurs around the value line before looking for an active correction-moving manner to leverage an instant execution of a selling order. In a scenario where the resistance line breaches northward, the $0.00050 resistance level will be the next target.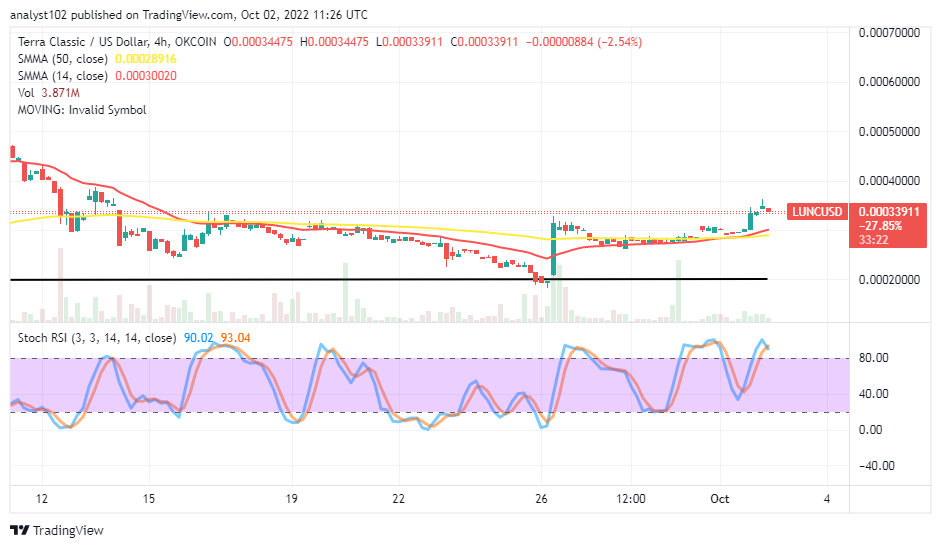
LUNC/USD Medium Chart
The LUNC/USD medium-term chart reveals the crypto market hikes toward the $0.00040 resistance level above buying signal sides of the SMA trend lines. The 14-day SMA indicator has slightly detached northward from the conjoined area with the 50-day SMA. The Stochastic Oscillators have penetrated the overbought region, maintaining posture portending the possibility of a re-occurrence of declining motion in the near time. Therefore, buyers may have to hold on for a while.
Read more:
Join Our Telegram channel to stay up to date on breaking news coverage