Join Our Telegram channel to stay up to date on breaking news coverage
In today’s Tamadoge market, buying pressure is higher than the selling pressure as a result of this, the price is making some advancement to the upper level just as it was predicted in yesterday’s Tamadoge price analysis. In the 7th hour of today’s market, buying pressure took the price to the height of $0.025878 before traders begin to take their profits. This is the Tamadoge price analysis for today.
Tamadoge Market Data:
- TAMA/USD price now: $0.24208
- TAMA/USD market cap: $23,752,168
- TAMA/USD circulating supply:1,000,000,000
- TAMA/USD total supply: 1,049,733,333
- TAMA/USD coin market ranking: #2742
Key Levels
- Resistance: $0.025000 $0.0260000, $0.0271400
- Support: $0.020912, $0.020551, $0.0200000
Tamadoge Market Price Analysis: The Indicators’ Point of View
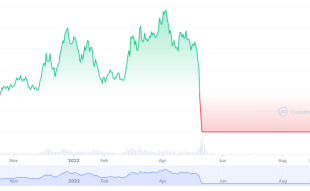
Tamadoge price analysis: The strong bullish market trend has driven the price of the crypto into the overbought territory. It is expected that the market will make some price corrections or retracement to a lower price level. Then the trend will continue to the upside. Looking at the Bollinger band, we can see that the recent bullish candlesticks are moving outside the upper band of the indicator. Usually, it is expected that the price TAMA/USD will correct back into the bands.
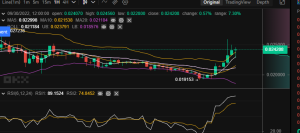
Tamadoge: TAMA/USD 5-Minute Chart Outlook – Tamadoge Price Analysis
On the 5-minute timeframe, the market has crossed below the Bollinger curve and is now in between the middle curve (line) and the lower band. At this point, buyers and sellers are in a tug-of-war and none can influence the direction of the market for now because they are becoming evenly matched. The RSI line is moving slightly below the midpoint of the indicator. It is now preparing to take up an upper position.
Join Our Telegram channel to stay up to date on breaking news coverage