Join Our Telegram channel to stay up to date on breaking news coverage
The price action of Tamadoge is moving in a consolidating market pattern. Such market patterns usually precede a decisive market movement. For Tamadoge, it is more likely the trend go to the upside after the ranging market. This is an opportunity for investors to buy this crypto because it will be profitable.
TAMADOGE Market Price Statistic:
- TAMA/USD price now: $0.2141
- TAMA/USD market cap: $21,595,459
- TAMA/USD circulating supply:1,000,000,000
- TAMA/USD total supply: 1,049,733,333
- TAMA/USD coin market ranking: #2797
Key Levels
- Resistance: $0.022665, $0.0240000, $0.024882
- Support: $0.020912, $0.020551, $0.0200000
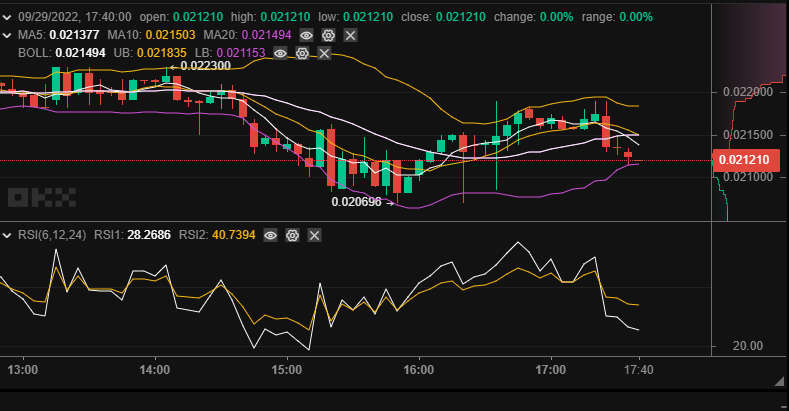
Tamadoge Market Price Analysis From The Indicators’ Point of View
The upper band and the lower band of the Bollinger band are converging; this shows Tamadoge is entering into a price consolidating period. The 15th-hour candlestick and the 16th-hour candlestick are signs pointing to imminent bullish market performance. Those two candles rest on the lower band of the indicator. This increases the probability of a bullish market movement TAMA/USD because the two candles are touching the lower band of the indicator.
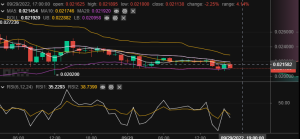
Tamadoge From the 5-Minute Chart Outlook
In this timeframe of, we can see how the bulls are pushing the price to the upper price level as more people are beginning to buy. The RSI line is now above the 50% midpoint of the Relative Strength Index. Soon, this price advancement will reflect in bigger timeframes. We also observe the price action taking support near the lower band of the Bollinger band indicator. As a result of this, the price action has moved up to a higher price level.
Join Our Telegram channel to stay up to date on breaking news coverage