Join Our Telegram channel to stay up to date on breaking news coverage
The Synthetix price prediction shows that SNX slips as the price drops to $3.12, which may create a new low in the next negative move.
Synthetix Prediction Statistics Data:
- Synthetix price now – $3.12
- Synthetix market cap – $783.3 million
- Synthetix circulating supply – 253.3 million
- Synthetix total supply – 315.6 million
- Synthetix Coinmarketcap ranking – #62
SNX/USD Market
Key Levels:
Resistance levels: $4.0, $4.2, $4.4
Support levels: $2.4, $2.2, $2.0

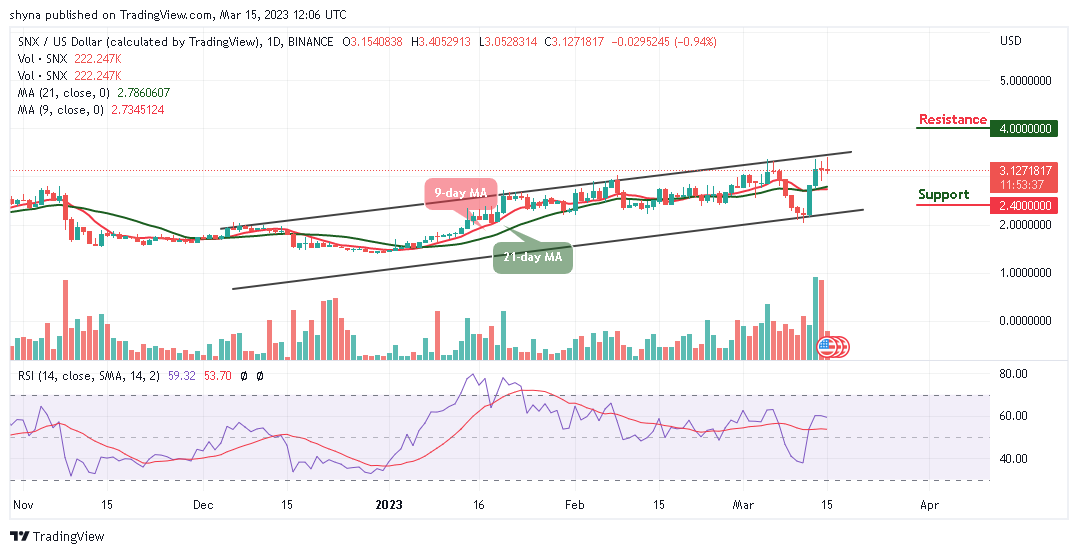
After touching the daily high at $3.40, SNX/USD falls to touch the nearest support at $3.12, which is now, subject to the price actions above the 9-day and 21-day moving averages. Meanwhile, the bears are likely to take charge if the coin heads to the south. However, an upward movement above the upper boundary of the channel may play out if the coin spike to the upside.
Synthetix Price Prediction: SNX/USD May Retreat to Rebound
According to the daily chart, the Synthetix price is hovering at $3.12 as the coin remains above the 9-day and 21-day moving averages. If the coin decides to follow the bearish movement, it could head toward the lower boundary of the channel which could hit the support levels at $2.4, $2.2, and $2.0.
Meanwhile, if the technical indicator Relative Strength Index (14) rebounds and crosses above the 60-level, the bulls may keep the Synthetix price above the 9-day and 21-day moving averages. Therefore, any further bullish movement above the upper boundary of the channel could hit the resistance levels of $4.0, $4.2, and $4.4. Looking at it technically, any negative movement to the downside may introduce more bearish signals which could create additional lows within the market before heading to the upside.
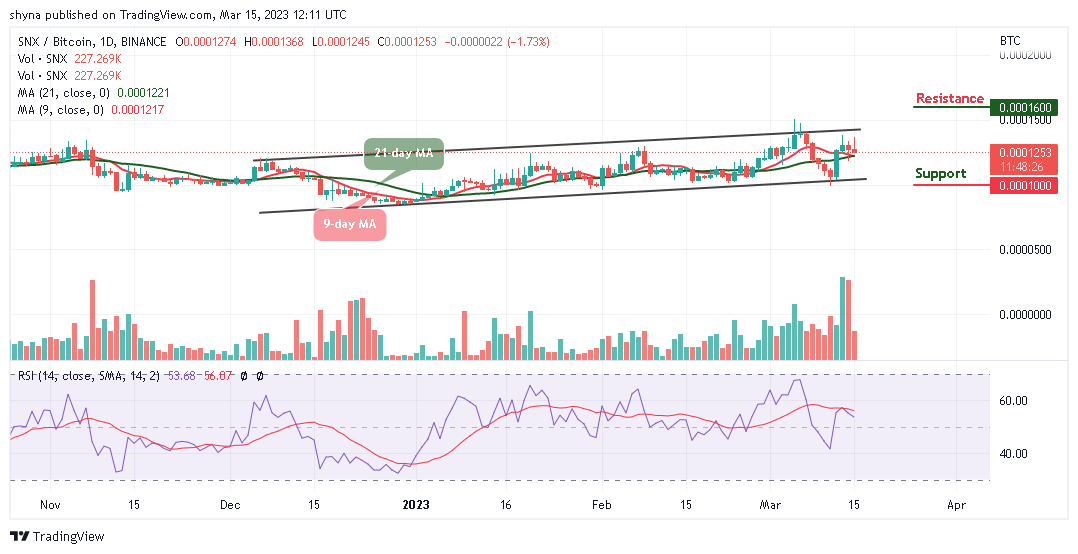
When compares with Bitcoin, the Synthetix price is likely to follow the downtrend where the market price is expected to cross below the 9-day and 21-day moving averages. On the contrary, if the price crosses above the upper boundary of the channel, the market may experience an upward trend that could touch the nearest resistance level at 1600 SAT and above.

Nevertheless, if the bears put more pressure and create additional lows, SNX/BTC may cross below the lower boundary of the channel to hit the support at 1000 SAT and below. Moreover, the technical indicates Relative Strength Index (14) stays below the 60-level as the signal line faces down.
Alternatives to Synthetix
The Synthetix price may begin to rise and could probably cross the upper boundary of the channel if the bulls hold the support level of $3.0. Meanwhile, any reversal towards the lower boundary of the channel may welcome the bears back into the market. However, The Fight Out presale is ongoing and the token has been witnessing impressive traction from users and the investor community. Moreover, the FGHT tokens are increasing every week as close to $6 million has been raised so far.
Join Our Telegram channel to stay up to date on breaking news coverage


