Join Our Telegram channel to stay up to date on breaking news coverage
The Stellar price prediction may cause the coin to create a new upward movement as the technical indicator heads to the north.
Stellar Price Prediction Statistics Data:
- Stellar price now – $0.131
- Stellar market cap – $3.6 billion
- Stellar circulating supply – 27.5 billion
- Stellar total supply – 50 billion
- Stellar Coinmarketcap ranking – #19
XLM /USD Market
Key Levels:
Resistance levels: $0.170, $0.180, $0.190
Support levels: $0.090, $0.080, $0.070
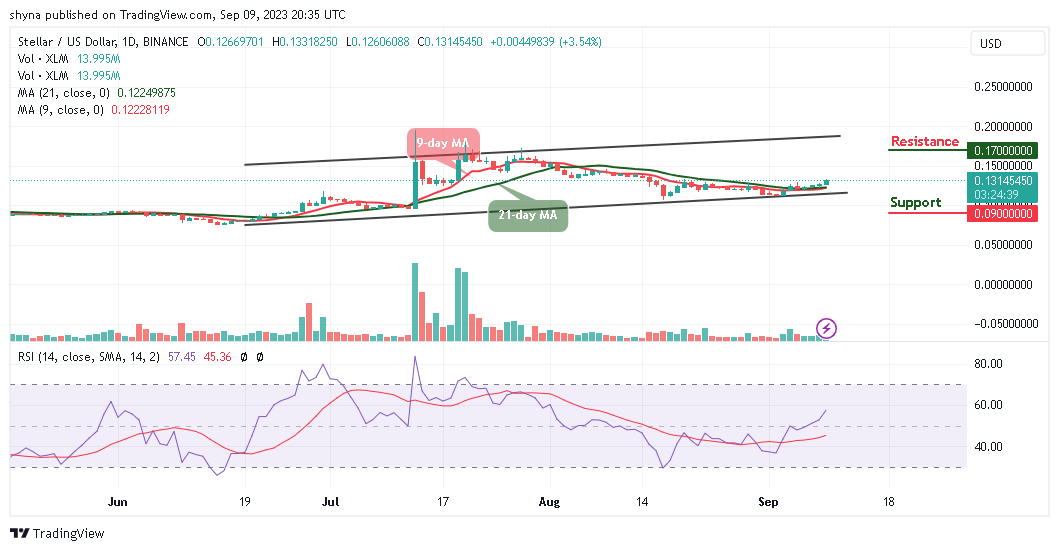
XLM/USD is currently recovering above $0.130 and it is likely to climb above $0.150 soon. The Stellar price is now hovering above the 9-day and 21-day moving averages as bulls are dominating the market. Meanwhile, the red line of the 9-day MA could move to cross above the green line of the 21-day MA to confirm that the bulls are here for business.
Stellar Price Prediction: XLM Price Could Reach $0.150 Level
According to the daily chart, the Stellar price may continue to create a new uptrend as it is likely for the coin to hit the resistance level of $0.150 if the price moves toward the upper boundary of the channel. Meanwhile, XLM/USD may continue to follow the bullish movement if bulls keep the coin above the moving averages.
However, if the traders could see a tremendous climb toward the upper boundary of the channel which is fast approaching; it may likely hit the resistance at $0.170, $0.180, and $0.190 levels. On the contrary, sliding below the lower boundary of the channel could hit the critical support levels of $0.090, $0.080, and $0.070 respectively while the technical indicator Relative Strength Index (14) moves to cross above 60-level.
XLM/BTC Could Hit 500 SAT Resistance
Against Bitcoin, the Stellar price may continue to follow a bullish sentiment as the coin moves to cross above the upper boundary of the channel. However, the coin is currently facing the upside as the bulls prepare for additional gains. Meanwhile, the sellers may release huge pressure on the market if the coin crosses below the 9-day and 21-day moving averages.
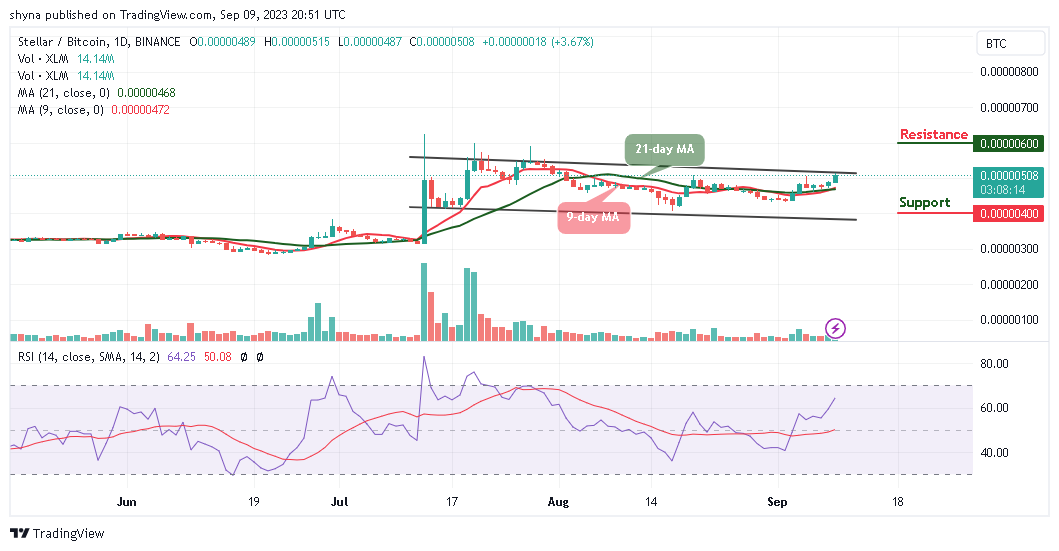
Currently, the technical indicator Relative Strength Index (14) is moving to cross above the 70-level, but if the bears bring the market price toward the lower boundary of the channel, XLM/BTC could hit the support level of 400 SAT and below. However, a push above the upper boundary of the channel could lead the market price to the resistance level of 600 SAT and above.
Alternatives to Stellar
The Stellar price is hovering around the resistance level of $0.131 after touching the daily high of $0.133 during the European session today. This is a move that could easily pave the way for gains toward the upper boundary of the channel to touch the resistance level of $0.150. Therefore, if the technical indicator Relative Strength Index (14) crosses above the 60-level, the market may show that the bullish grip is getting stronger.
Nonetheless, while other tokens experience a decrease in popularity, the Wall Street Memes token remains a “buy” recommendation due to its attractively low presale price. With gains surpassing $25 million, it’s a prudent decision to acquire some tokens at their current price before they witness a significant increase.
CoinCodex - Our Recommended Crypto Research Platform

- Live Cryptocurrency Prices for Over 20,000 Coins
- Crypto Price Analysis with Popular Technical Indicators
- Crypto Price Predictions with Short and Long-Term Charts
- Historical Crypto Market Data Dating to 2010
- Crypto Portfolio, Profit Calculator, and Other Investment Tools
Join Our Telegram channel to stay up to date on breaking news coverage