Join Our Telegram channel to stay up to date on breaking news coverage
The Stellar price prediction is recovering from the daily opening price at the $0.124 level as the price continues to fluctuate.
Stellar Prediction Statistics Data:
- Stellar price now – $0.133
- Stellar market cap – $3.5 billion
- Stellar circulating supply – 27.13 billion
- Stellar total supply – 50 billion
- Stellar Coinmarketcap ranking – #22
XLM/USD Market
Key Levels:
Resistance levels: $0.170, $0.180, $0.190
Support levels: $0.095, $0.085, $0.075
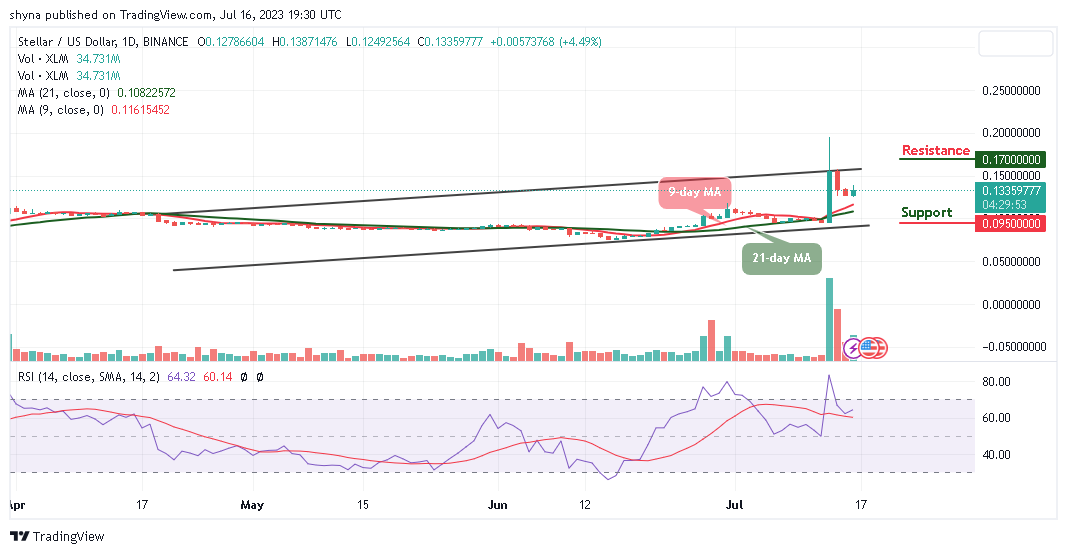
XLM/USD is trading above the 9-day and 21-day moving averages after touching the daily high at the $0.138 resistance level. At the time of writing, Stellar is changing hands at $0.133, having gained over 4.49% since the beginning of the European session. However, with latest the recovery, the coin is likely to cross above the upper boundary of the channel to increase the bullish movement.
Stellar Price Prediction: Can XLM Break Above $0.150?
The Stellar price stays above the 9-day and 21-day moving averages at the price level of $0.133. However, if the bulls begin the upward trend, XLM/USD may likely move to touch the resistance levels of $0.170, $0.180, and $0.190 to push the price to the upside. In other words, any strong selling pressure below the 21-day moving average could drag the price toward the lower boundary of the channel if the bears step back into the market.
However, should in case Stellar trade below the moving averages, a bearish continuation could bring the price to the supports of $0.095, $0.085, and $0.075. Meanwhile, the technical indicator Relative Strength Index (14) is likely to cross above the 70-level, indicating a possible bullish movement.
When compares with Bitcoin, the Stellar price is heading to the north as the coin moves above the 9-day and 21-day moving averages. However, following the recent positive sign, the current market movement may begin to follow an uptrend if the buyers push the price above the upper boundary of the channel.
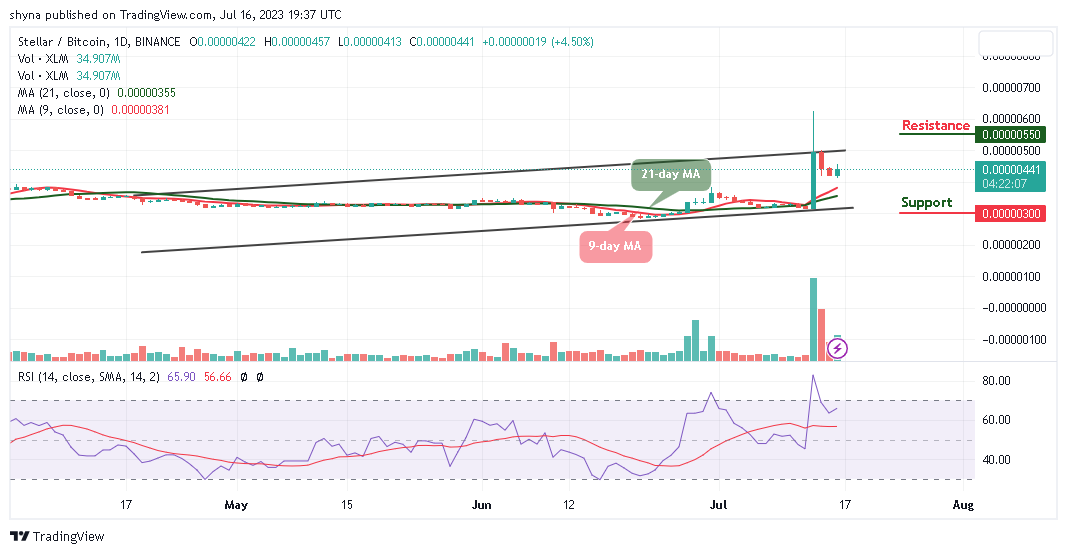
Moreover, as the technical indicator, Relative Strength Index (14) remains above the 60-level, once it increases the bullish pressure, the market price could hit the resistance level of 550 SAT and above. Meanwhile, a retest below the lower boundary of the channel could lower the price to the support level of 300 SAT and below.
Stellar Alternatives
The Stellar price is hovering around $0.133 with a bullish movement above the 9-day and 21-day moving averages. However, if the bulls put more pressure, the Stellar price may cross above the upper boundary of the channel. Moreover, the technical indicator Relative Strength Index (14) is moving to cross into the overbought region as the signal line faces the north.
Nonetheless, considering the hype around the Wall Street Memes, some suspect it could be a promising prospect for major crypto exchanges. Now, the creators are leveraging their expertise and understanding of the digital assets space to launch $WSM, allowing holders to gain financial exposure to the growth of the Wall Street Memes brand. Since the launch, the token has raised almost $16 million in the ongoing presale.
New OKX Listing - Wall Street Memes

- Established Community of Stocks & Crypto Traders
- Featured on Cointelegraph, CoinMarketCap, Yahoo Finance
- Rated Best Crypto to Buy Now In Meme Coin Sector
- Team Behind OpenSea NFT Collection - Wall St Bulls
- Tweets Replied to by Elon Musk
Join Our Telegram channel to stay up to date on breaking news coverage