Join Our Telegram channel to stay up to date on breaking news coverage
The Ripple price prediction shows that XRP is rising with a gain of 7.53% over the past 24 hours as it rises above the $0.750 level.
Ripple Prediction Statistics Data:
- Ripple price now – $0.768
- Ripple market cap – $40.65 billion
- Ripple circulating supply – 52.5 billion
- Ripple total supply – 99.9 billion
- Ripple Coinmarketcap ranking – #4
XRP/USD Market
Key Levels:
Resistance levels: 1.000, $1.100, $1.200
Support levels: $0.500, $0.400, $0.300
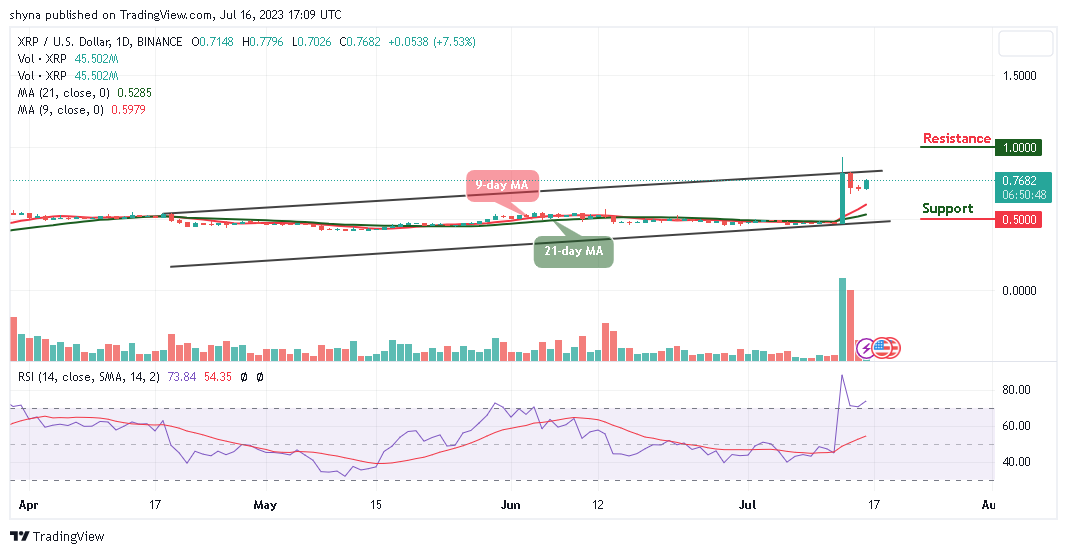
XRP/USD is trading above the resistance level of $0.768 as the coin heads to the upside. It could be possible that the more the resistance level of $0.770 is tested, the more it is likely to break higher. However, if the Ripple price crosses below the 9-day and 21-day moving averages, traders could expect the market price to break beneath, and this may likely hit the critical support levels of $0.500, $0.400, and $0.300.
Ripple Price Prediction: Ripple (XRP) May Break Higher
According to the daily chart, the Ripple price is hovering around $0.768 with a strong bullish movement above the moving averages. However, should in case the bulls put more pressure, the Ripple price may cross above the upper boundary of the channel to hit the resistance levels at $1.000, $1.100, and $1.200.
However, the technical indicator Relative Strength Index (14) is beginning to recover from the downtrend as the signal line remains above the 70-level. Meanwhile, the bulls may come into focus if a larger divergence to the upside is noticed within the market.
Against Bitcoin, the Ripple price is also trading bullishly above the 9-day and 21-day moving averages. After bottoming out around the 2236 SAT a few days ago, the price begins to slowly ascend and it is currently trading around the 2554 SAT. However, the Ripple price is now moving within the channel as the sellers are dominating the market.
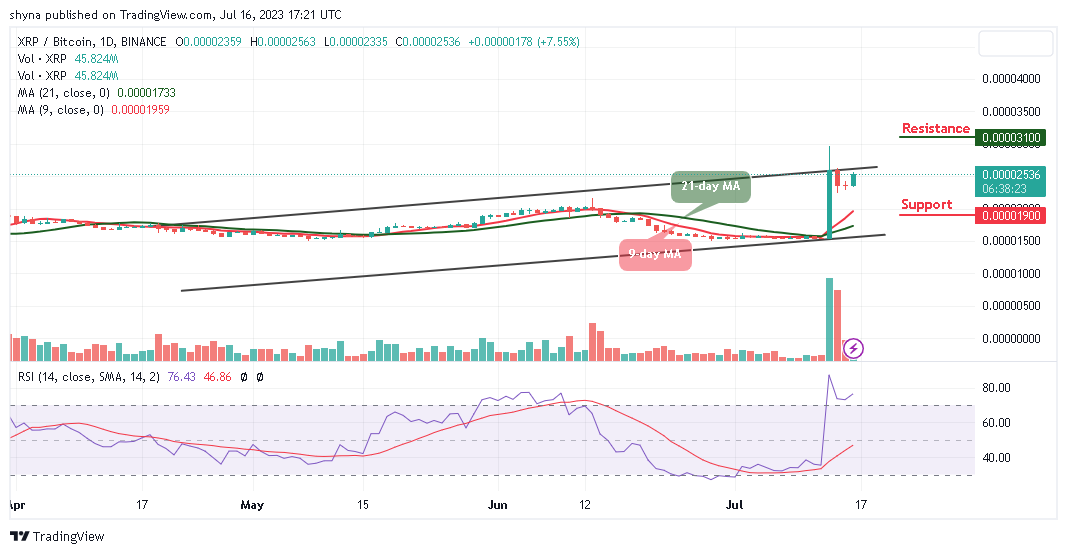
From above, if the bulls can push the coin above the upper boundary of the channel, traders may expect initial resistance to be located at 3000 SAT. Therefore, any further bullish movement may hit a higher resistance level at 3100 SAT and above. Alternatively, If the sellers bring the market toward the lower boundary of the channel, XRP/USD may hit critical support at 1900 SAT and below. Meanwhile, the Relative Strength Index (14) confirms the bullish movement as the signal line points up.
Ripple Alternatives
According to the daily chart, the Ripple price is hovering around $0.76 with a slight bullish movement above the 9-day and 21-day moving averages. It could be possible that if the resistance level of $0.80 is tested, it is likely for the coin to break higher.
However, Wall Street Memes is already making progress towards wider recognition, attracting the attention of prominent influencers. With significant interest already on display, Wall Street Memes has all the ingredients to become a major player in the meme coin space raising almost $16m in the on going presale..
Read more:
- Bitcoin Price Prediction: BTC/USD Takes a Breathe, Consolidates Between $14,600 and $15,800
- Litecoin Price Prediction – After Touching $43.47, LTC/USD Makes a Quick Return to $40 Support Level
New OKX Listing - Wall Street Memes

- Established Community of Stocks & Crypto Traders
- Featured on Cointelegraph, CoinMarketCap, Yahoo Finance
- Rated Best Crypto to Buy Now In Meme Coin Sector
- Team Behind OpenSea NFT Collection - Wall St Bulls
- Tweets Replied to by Elon Musk
Join Our Telegram channel to stay up to date on breaking news coverage