Join Our Telegram channel to stay up to date on breaking news coverage
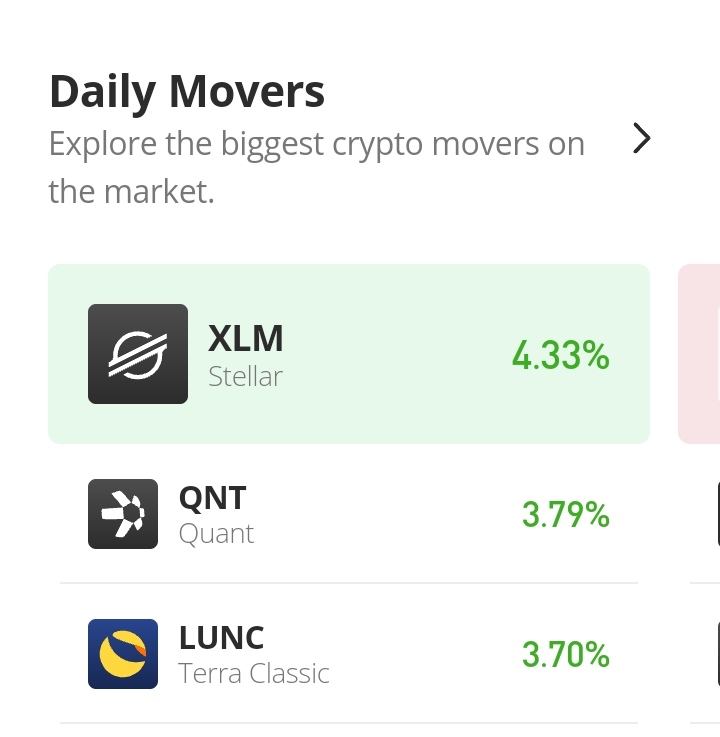
The Stellar Market was very bullish in yesterday’s market. It was towards the end of the trading session on the 28th of September that bulls started to increase pressure and took the market. They continued on the following day with a very strong bullish market move that smashed through the $0.1100000 price level. It was even almost touching the $0.120000 price level before traders began to take their profits
Stellar Market Price Statistic:
- XLM/USD price now: $0.11583000
- XLM/USD market cap: $2,949,473,450
- XLM/USD circulating supply: 25.4 Billion
- XLM/USD total supply:50,001,787,570
- XLM/USD coin market ranking: #25
Key Levels
- Resistance: $ 0.12000000, $0.125000000, $0.13000000
- Support: $0.10827582, $0.105000000, $0.10133302
Your capital is at risk
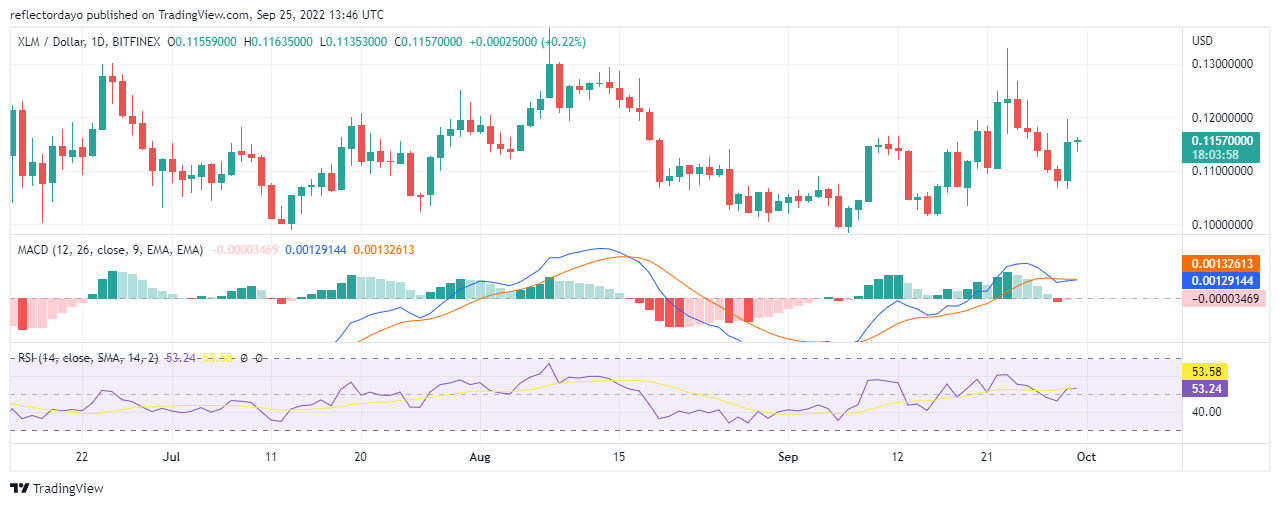
Stellar Market Price Analysis: The Indicators’ Point of View
The price direction of Stellar (XLM/USD) that was going the bearish way had a very sharp switch of the trend to the bullish way after finding its support at $0.10812552. After the bullish market move, the market retraces a lower price level (this is as a result of the very strong movement which must, inevitable experience a short drawback in trend). At the moment, the brief retracement may be coming to an end. But as it comes to an end, the market seems to be struggling to find a direction. The indicators were just about responding to the change of direction that started yesterday that is due to the strength at which the market moved. Today, the MACD line is just touching the signal line. it has not even crossed it. And it lingers at the point as the market faces indecision.
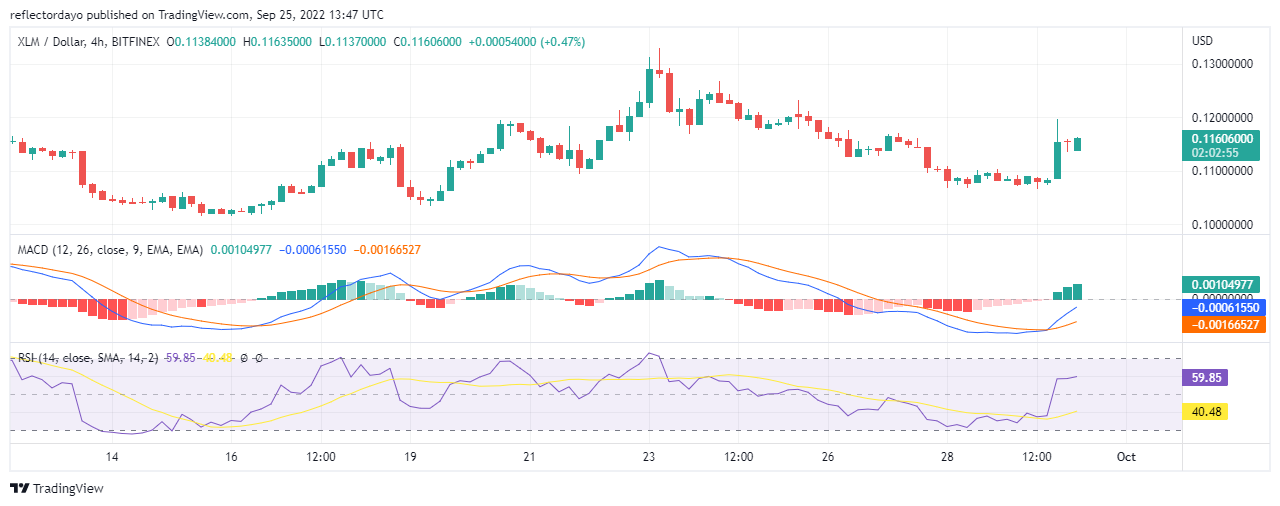
XLM/USD 4-Hour Chart Outlook
The strong price retracement of the market trend continued from yesterday into the very first 4-hours of today’s trading session. It was in the second session that the price of Stellar begins to pick uppick up again. The RSI line has now moved into the overbought territory. Because the retracement was as strong as the bullish move, the RSI line seem slow to respond to the retracement. It may be that because the bullish momentum was also quick to recover. This quick recovery cause a strong market gridlock that kept the price fixed at the current price for now.
Join Our Telegram channel to stay up to date on breaking news coverage