
Join Our Telegram channel to stay up to date on breaking news coverage
The Solana price prediction shows that SOL is still on the downside as the dip could get worsen because of a recent decline in the crypto world.
Solana Prediction Statistics Data:
- Solana price now – $12.57
- Solana market cap – $4.57 billion
- Solana circulating supply – 362.6 million
- Solana total supply – 534 million
- Solana Coinmarketcap ranking – #15
SOL/USD Market
Key Levels:
Resistance levels: $30, $32, $34
Support levels: $5, $3, $1
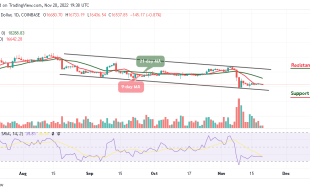
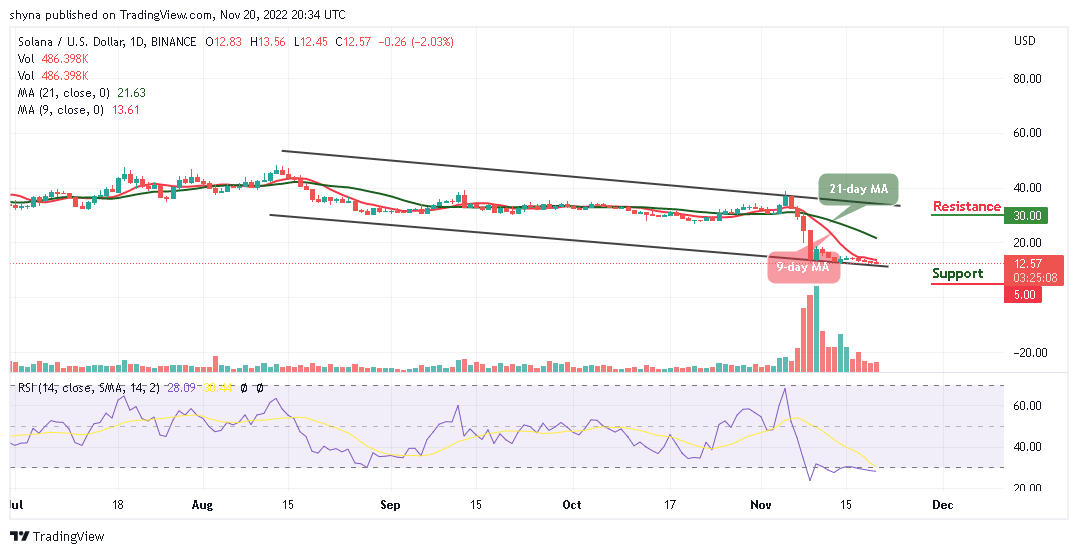
According to the daily chart, SOL/USD may not be able to follow the bullish movement as the coin remains below the 9-day and 21-day moving averages. The Solana price is currently trading at $12.57, sliding from the high of $13.56 to crossing below the lower boundary of the channel.
Solana Price Prediction: Solana Could Gain More Downsides
The Solana price is moving sideways, any bearish movement below the lower boundary of the channel may increase the short-term selling pressure, while the critical supports may come around $5, $3, and $1. Meanwhile, if the coin retraces and crosses above the 21-day moving average, it could reach the next resistance levels at $30, $32, and $34.
However, the technical indicator could start a new bearish session as the Relative Strength Index (14) remains within the oversold region. It is, however, not clear how long the session will last because, in the last few days, bears have been dominating the market.
Against Bitcoin, the market price is ranging as the coin trades at 7627 SAT below the 9-day and 21-day moving averages. Looking at the daily chart, if the coin can make a positive cross towards the upper boundary of the channel, the bulls may push the price to the upside.
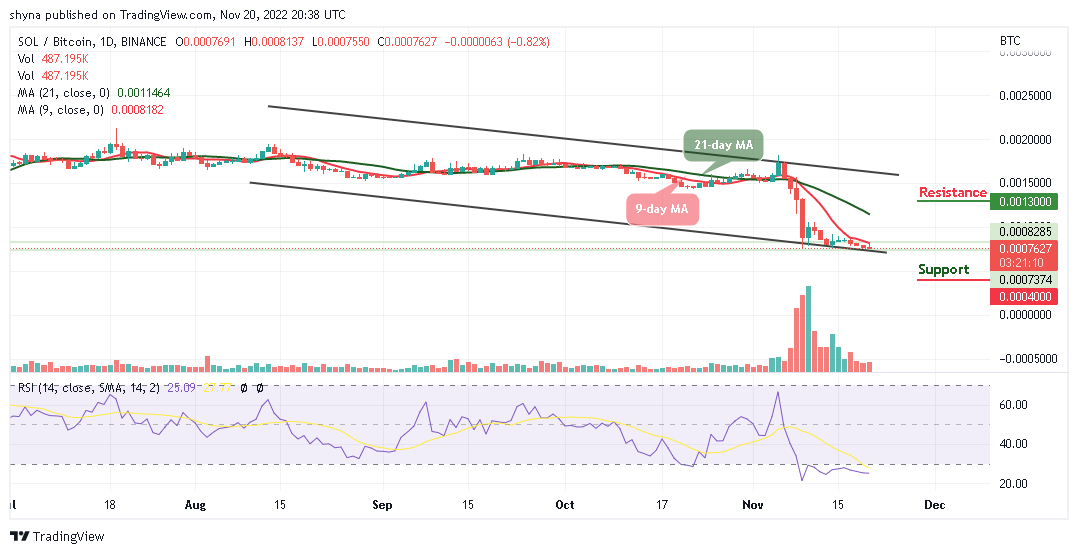
However, if the market drops below the lower boundary of the channel, the next key support may come at 4000 SAT and below. On the bullish side, a possible rise may push the coin above the 21-day moving average to hit the resistance level of 1300 SAT and above. The technical indicator Relative Strength Index (14) may begin to follow the sideways movement as the signal line moves in the same direction within the oversold region.
Watching the crypto market, the IMPT token presale is still performing positively. This eco-friendly token is selling out quickly as it attracts more and more investors. $13 million has been raised so far in its presale.
However, the collapse of FTX brings about a need for a cutting-edge trading intelligence platform, which is exactly what Dash 2 Trade offers. It is a platform that can adequately detect impending adverse issues similar to what happened to FTX, thus enabling investors and traders to pinpoint safe opportunities for good profits. The D2T token presale is ongoing and it has raised $6.5 million so far.
Join Our Telegram channel to stay up to date on breaking news coverage